MicroAI Dashboard Guide#
Once you have a profile and a device registered you are probably wondering where you can see the dashboard to monitor your device. This guide will explain how to see your device data on Launchpad.
Make sure you have created a profile for your use case. You can see how to create a profile for each specific use case in the “how to” guides in each use case drop down on the sidebar. Or, pick your use case from the drop down below and a new tab will open up to that use case how to.
Once you have a device registered, go back to your Launchpad account and go to the apps tab located on the sidebar. the page that opens should look like the image below.
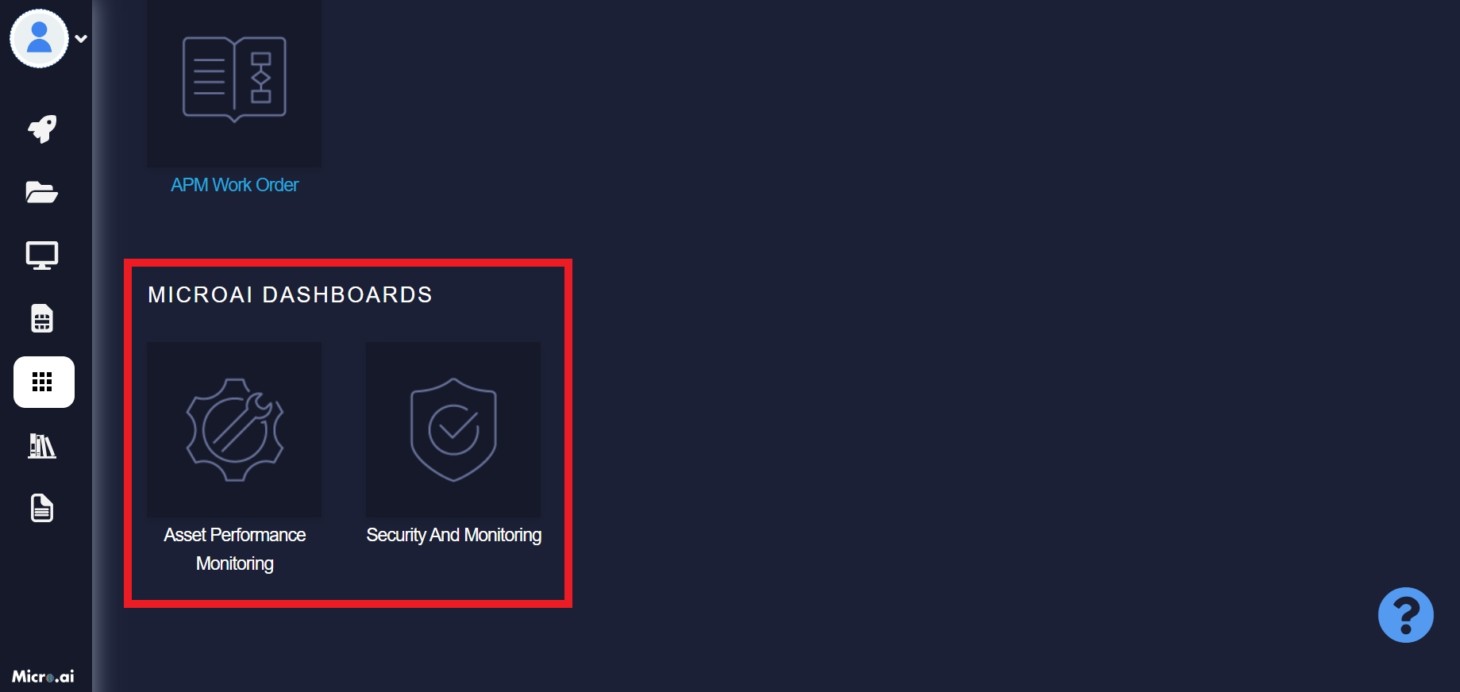
Click on the button that has your use case. If you have a device running Asset Performance Monitoring then you will click on the maintenance button, if you have a device running Security and Monitoring then click on that button. You should see a page open up that looks like the image below.
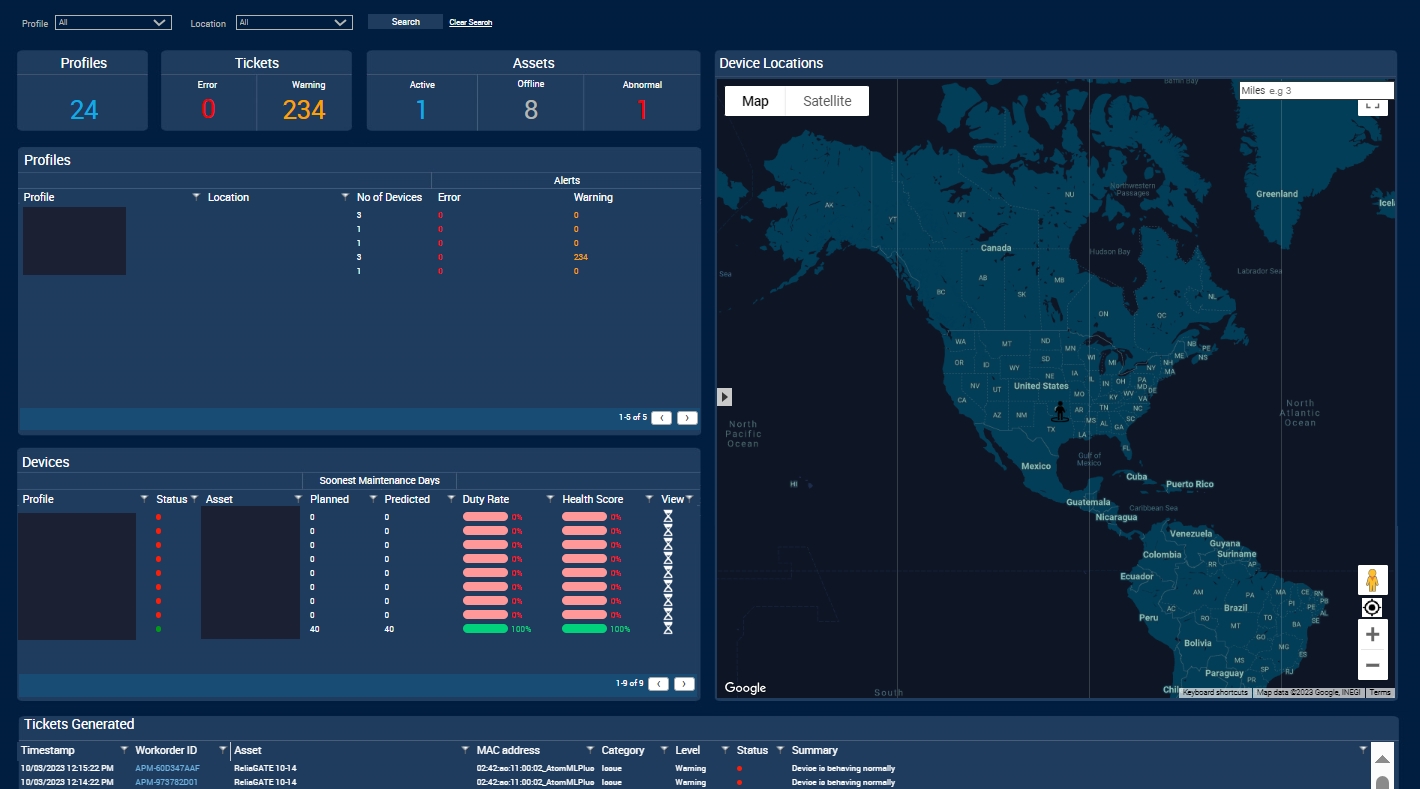
On the right hand side of the page you will see the devices you have registered. Click on the device you want to monitor and the following page should open up. Asset Performance Monitoring and Security and Monitoring will have some slight differences and those will be explained in the subsequent sections.
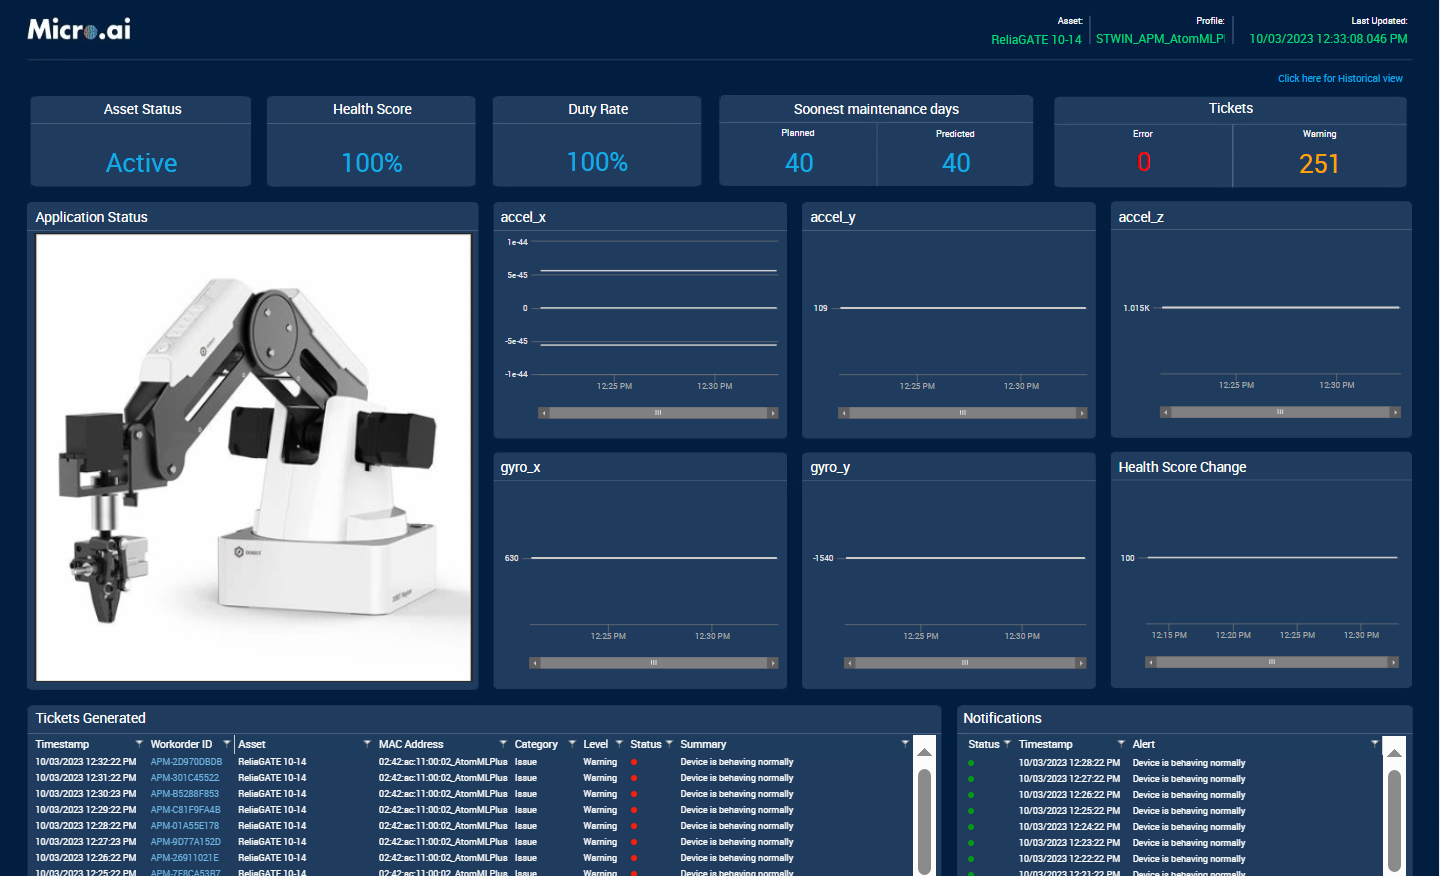
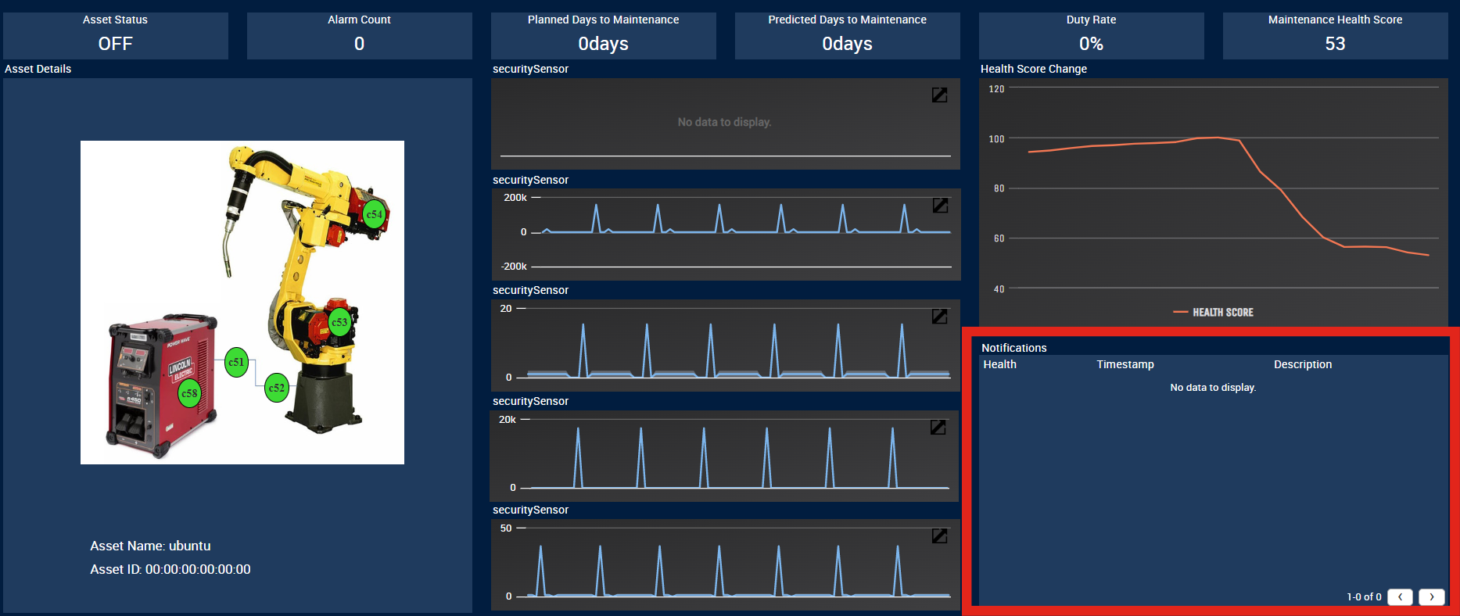
Dashboard for Asset Performance Monitoring#
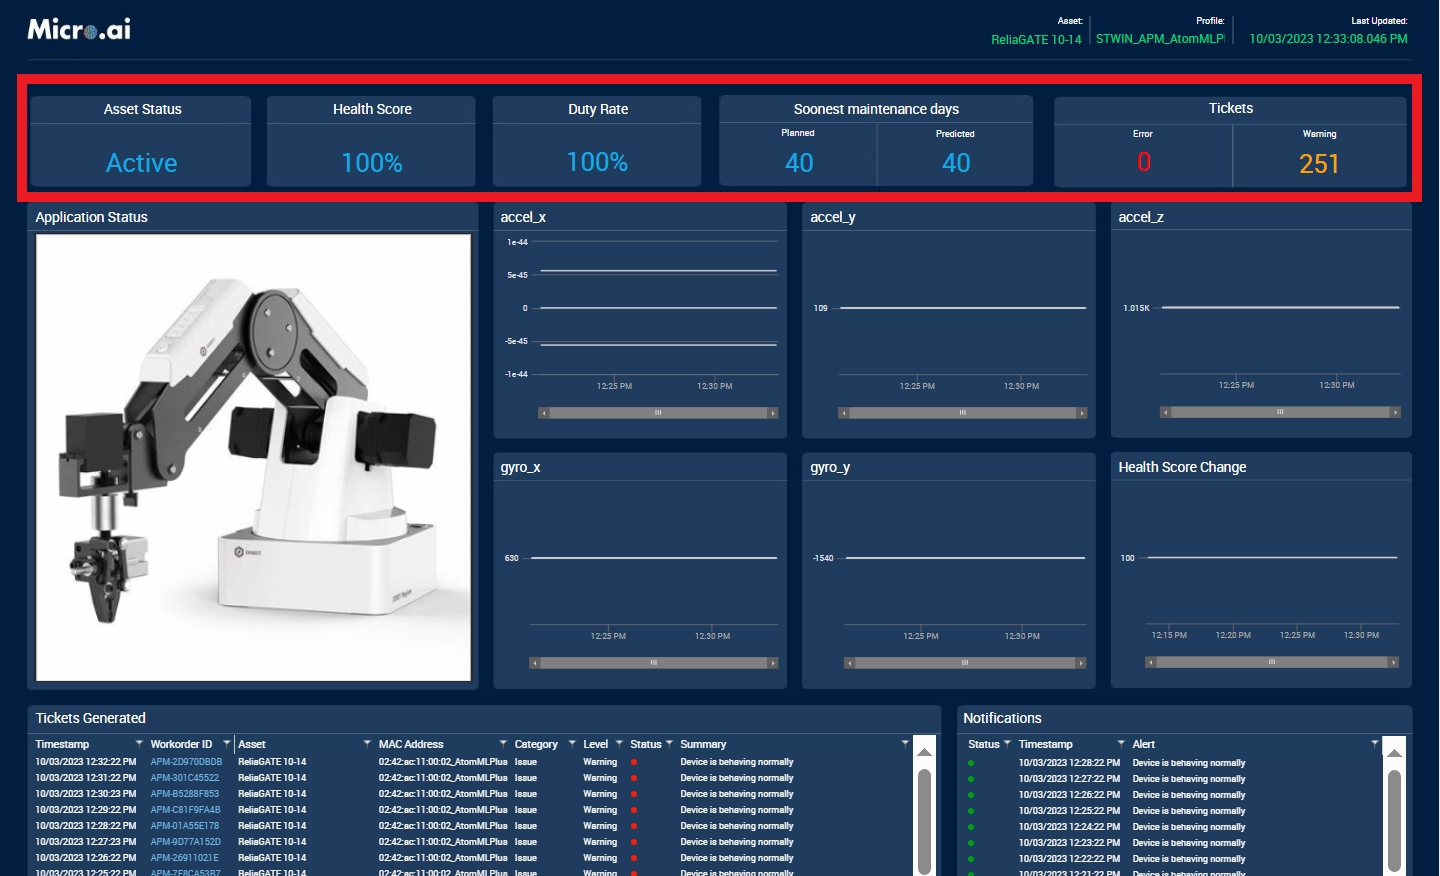
On the top of the Dashboard you will see several boxes. The first box on the left is the status of the Asset or Device. The next box is maintenance health score which is the real time health score, Next is duty rate, which is a percent amount of time the asset has been in operation since it was initially onboarded, Next is planned days to maintenance, this is inputted from the user and is their standard for when they maintain that device or the asset, next is predicted days to maintenance and is the AI predicted days to maintenance based off next-step performance prediction. The final box shows how many alarms have been generated for abnormal behavior.
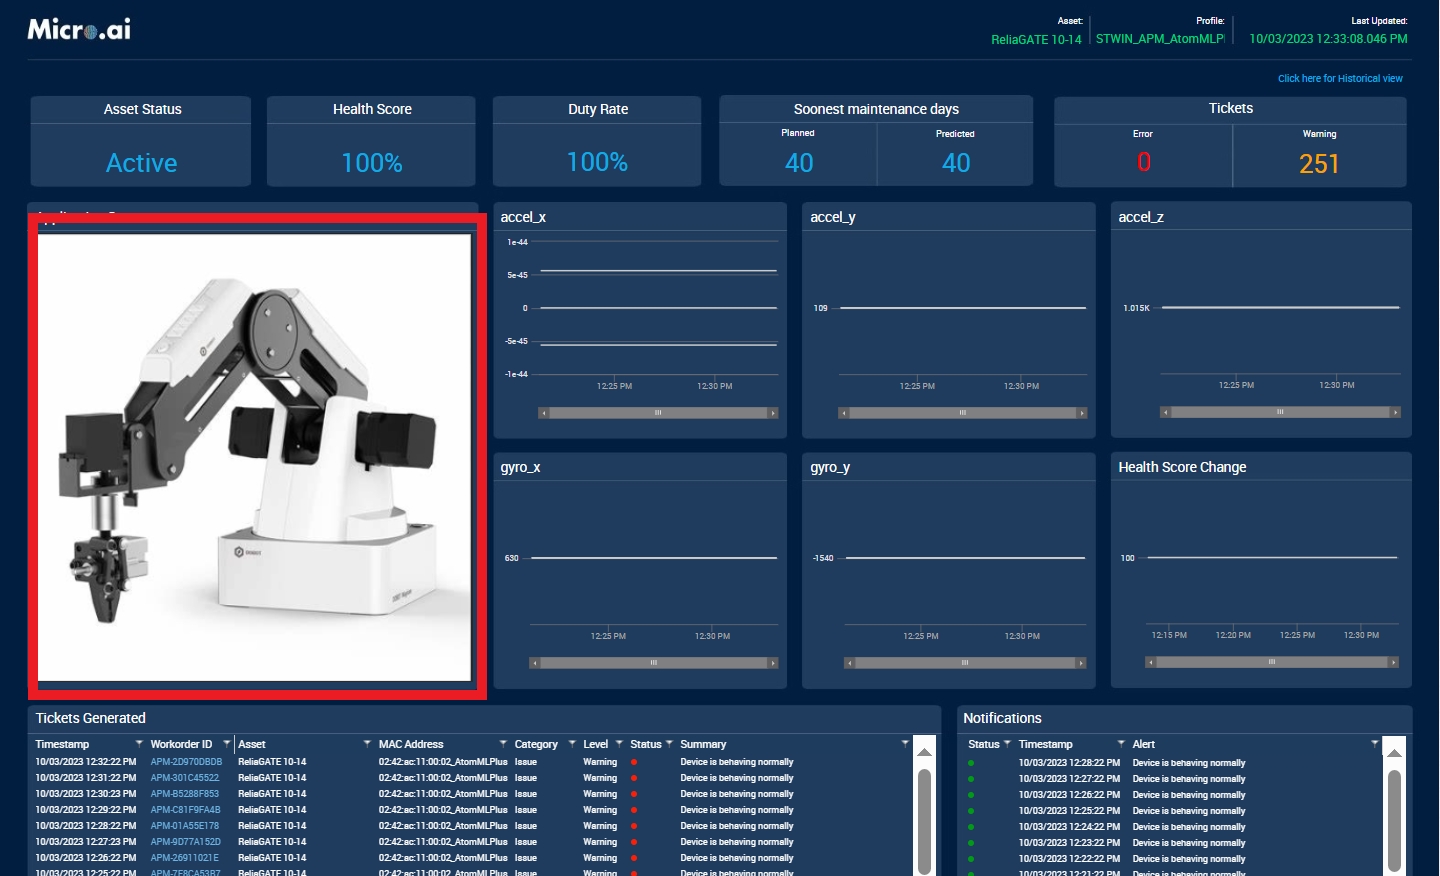
Next is asset details, this is where the user can upload a picture of the asset or device.
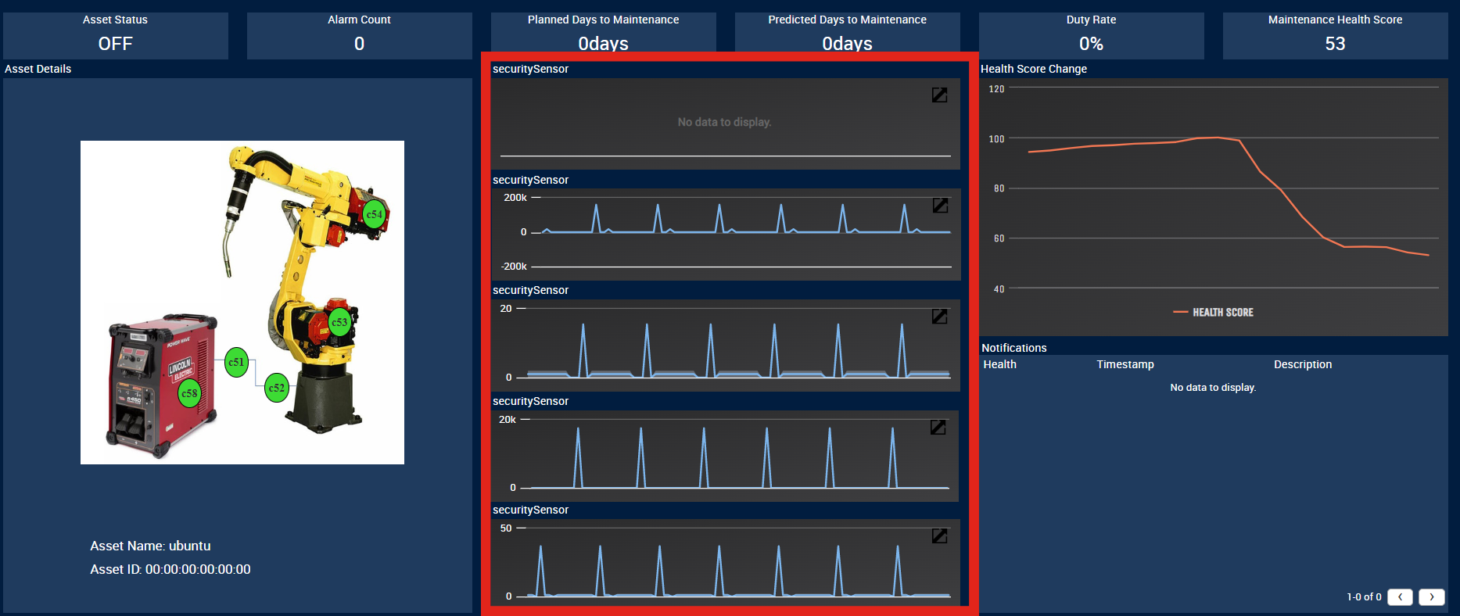
Next is the middle column, this is where the channel data will be displayed and will show the user defined bounds and the channel data in real time if in continuous mode or show the time interval of data around an abnormal event if in storage mode. Continuous and storage mode are explained in each use case how to.
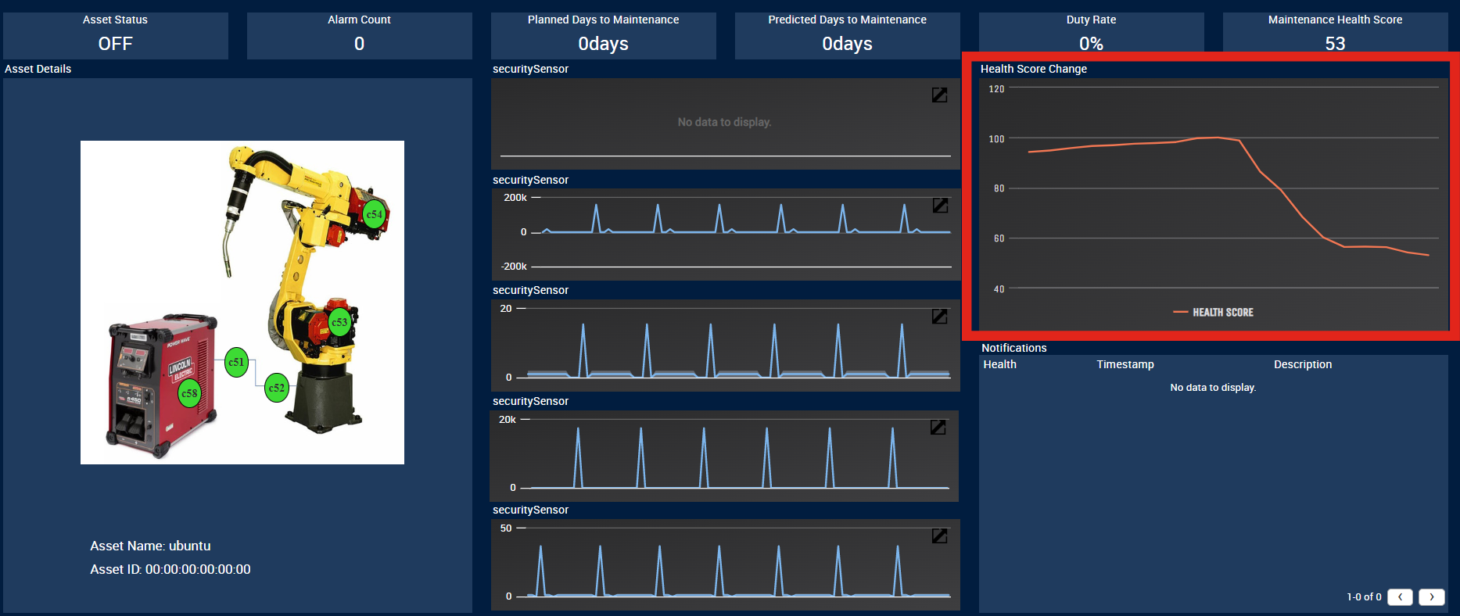
Next is health score change, this is the real time graph showing the change in health score when abnormal events occur.
Finally is the notification in the bottom right corner, this is where information surround alarms will be generate and displayed.
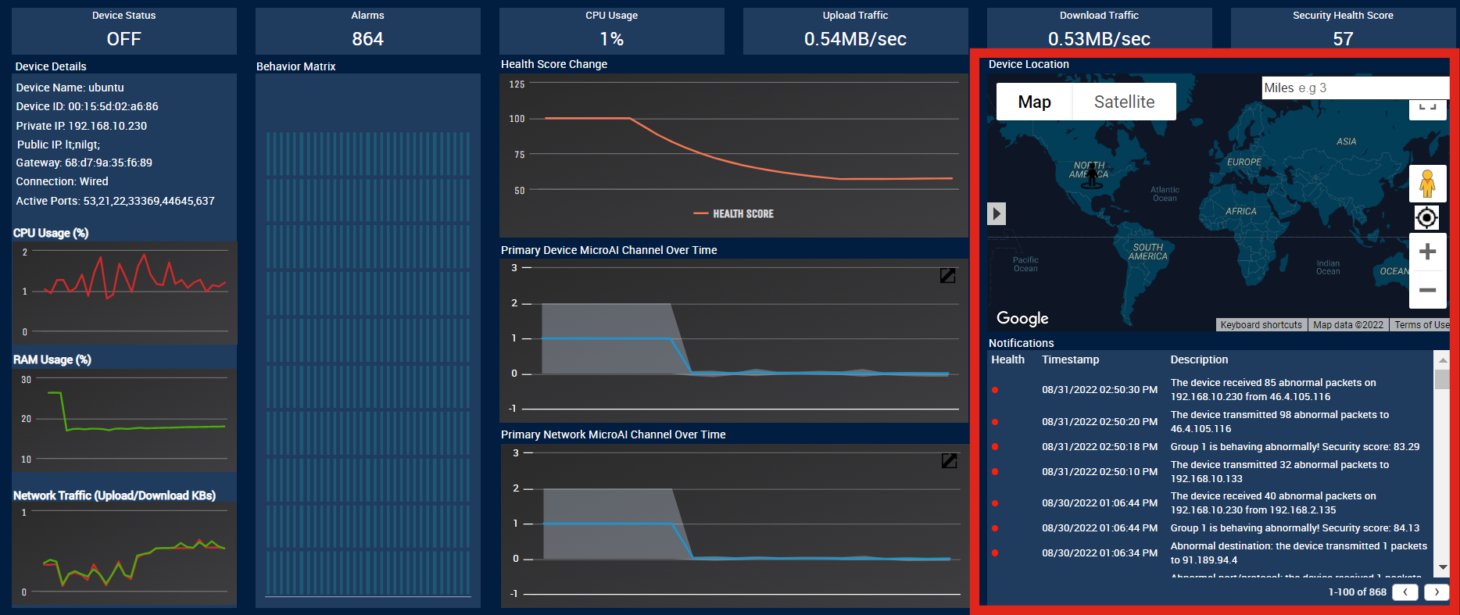
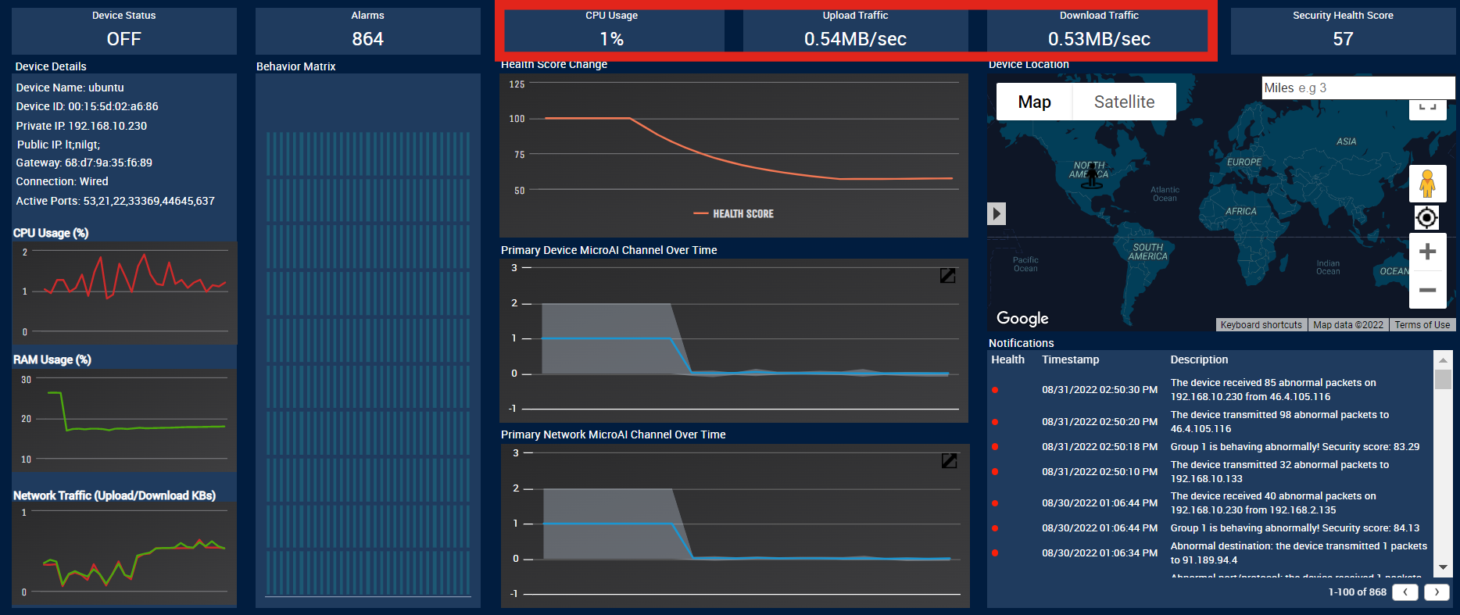
Dashboard for Security#
In the top of the security dashboard there are a few differences. The CPU usage is shown in percentage, the upload traffic and download traffic are also shown in MB/sec. These are the only differences in the top.
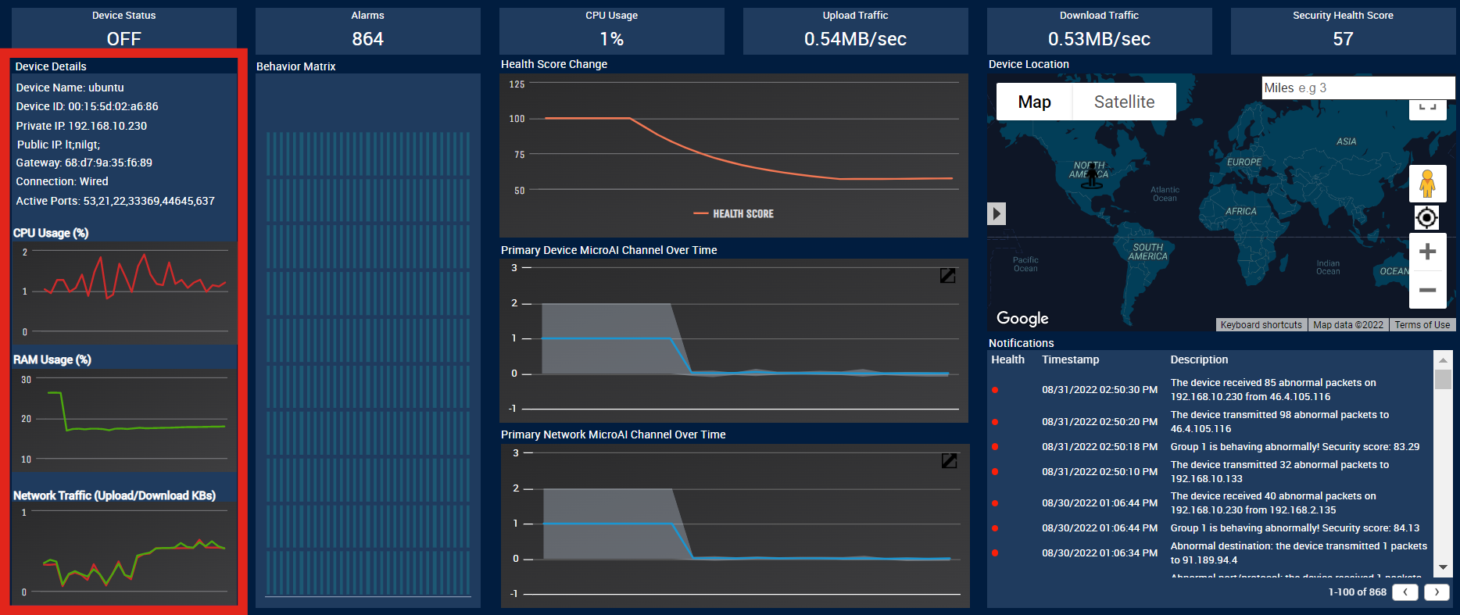
On the right hand side there is a new column, it shows the device details like device name, and ID but now also shows the device IP, gateway, active ports and more. Underneath the device details are several graphs showing the CPU usage, RAM usage and network traffic.
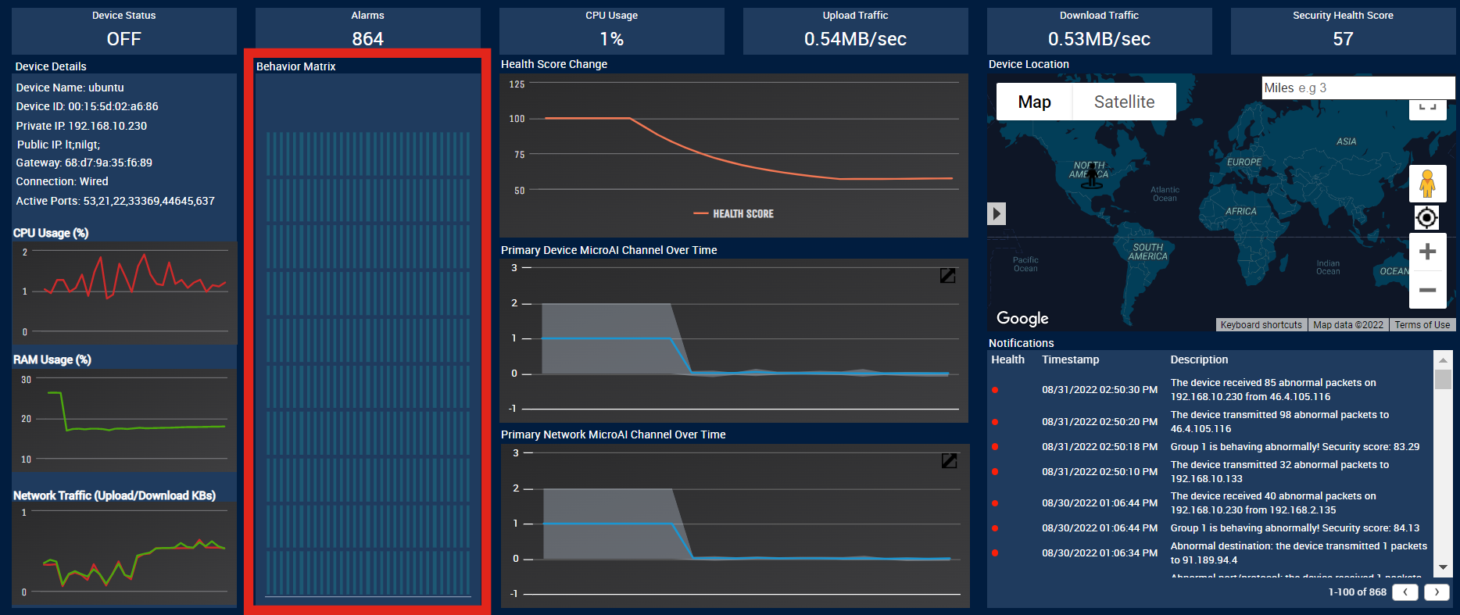
The channels for security are not named for security purpose but the column labeled Behavior Matrix has a matrix that represents each channel being monitored. Over time if there are security issues the channels being affected will light up inside the Behavior Matrix.
In the middle column there is Health Score change which is the same as Asset Performance Monitoring however, there are two other graphs that monitor the primary device channel over time and the primary network channel over time. This are the health groups you see when you register a profile for security and monitoring.
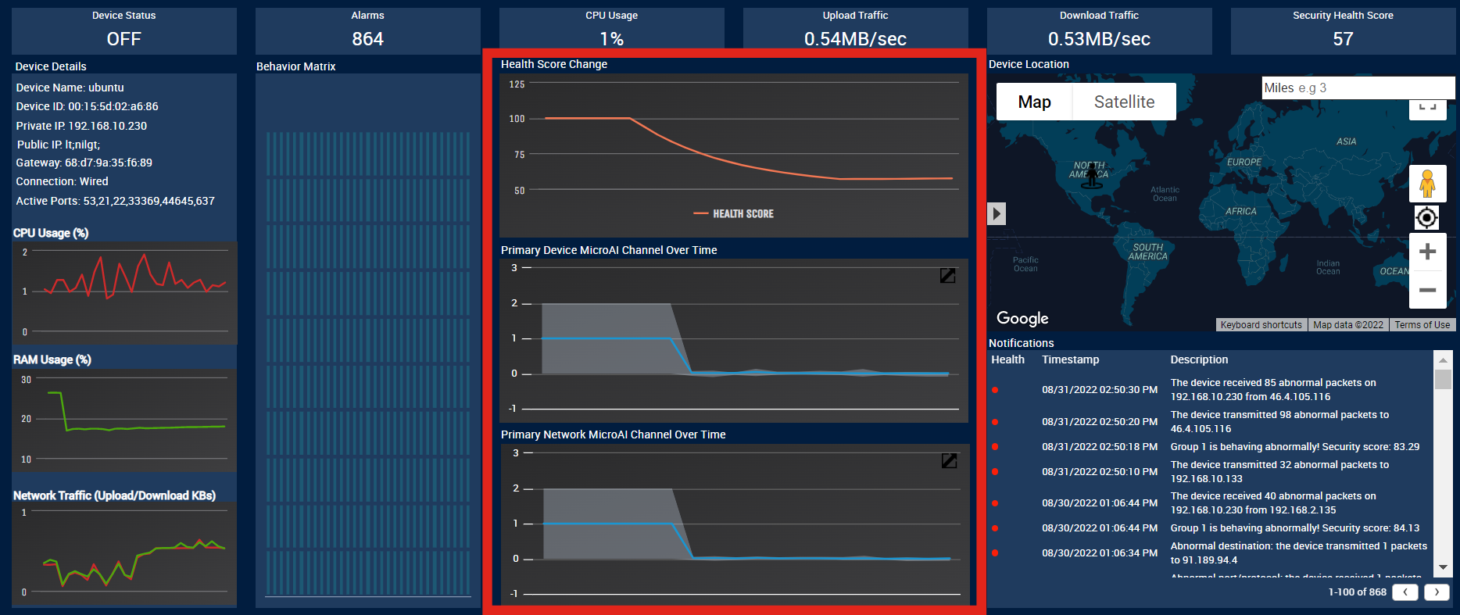
On the far right there is a map that will have your device location if you have inputed the latitude and longitude of your device and underneath your will have your security notification.