AIStudio Usage#
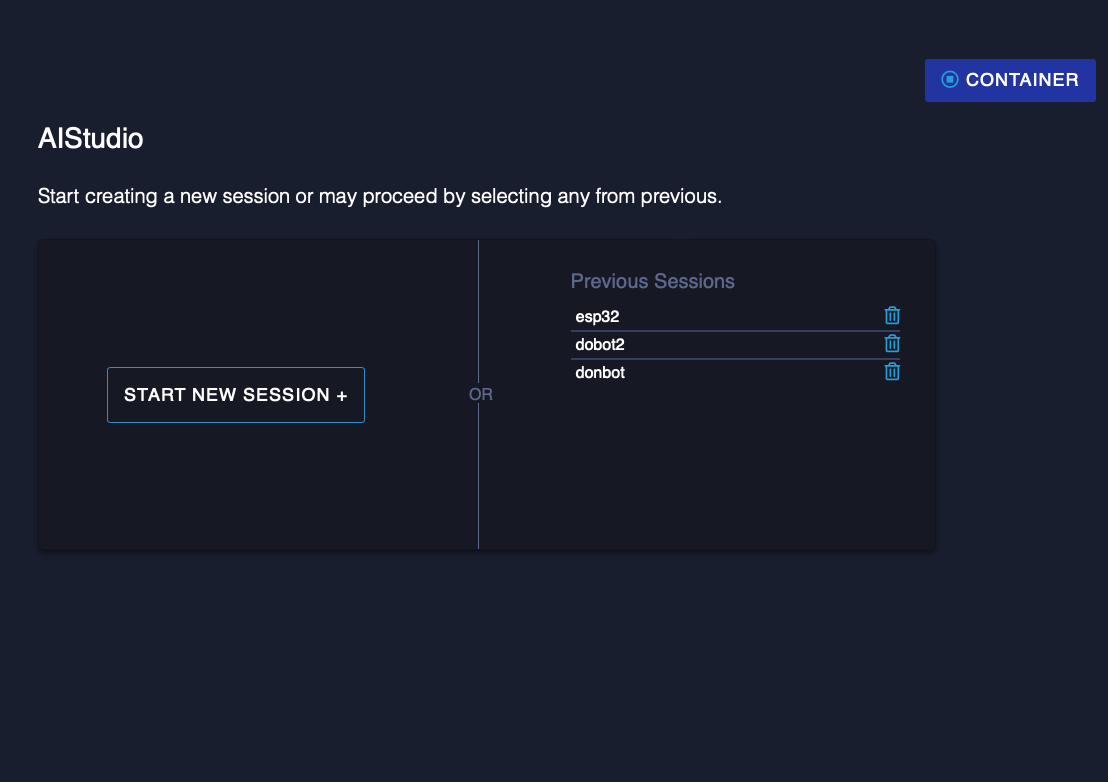
Sessions#
You can think of a Session as a “test-bench” for your configuration to tune AtomML+ for a specific use case. In a session you can visualize the data that you have imported, label abnormal data, and tune various AI parameters for analysis. You will receive real-time visibility on the effects on your data. In a session you can also compare multiple configurations, side-by-side.
A session is associated with a Launchpad Profile. This profile acts as a “digital twin” of your device and specifies all the sensors and the rate at which you will be receiving data from them. You can have multiple sessions associated with a single Launchpad Profile. You might want to use this if you have many similar devices, however, the environment that they operate in is different.
After importing your data, the following should serve as a good template for your usage of AIStudio:
Visualize Your Data
AIStudio provides the ability to visualize the raw data coming from your device as well as providing some basic statistical information about the output of your sensors. This is helpful for identifying how data might need to be transformed later on. For example, if a sensor has a high standard deviation, you might want to apply a moving average onto it to reduce its variance.
Label Anomalies and Set the Training Time
If you have uploaded a dataset with anomalies, you can label them here. You can also set the time at which you would like training to stop for your data. Everything to the left of the green dashed line will be considered the training data.
Tune Hyperparameters and Engineer Your Data
Once you have reached this step, you can look at your data - channel by channel - and evaluate what feature engineering functions and bound presets might work best. You can improve results from the AI engine by: * Augmenting anomalies in comparison to normal data through feature engineering * Increasing the looseness of bounds around noisy channels * Adding a small amount of noise to mostly static channels (if they change after a long time, a large anomaly can be predicted).
Run AtomML[+]
You have reached the easiest part! Hit run and watch it go. The amount of time that it takes depends on the size of the dataset and number of channels. It can take from a few minutes to a couple of hours.
Visualize and Tune Your Results
Here you can visualize the results as they came out of the AI engine and adjust the healthscore to your liking. You can see the alerts that you might receive by adjusting the threshold slider. Use the tooltips to understand the different components of the healthscore and how you can tune them.
Once you are satisfied with your tunings you can move on to the final step.
Send Your Configuration to Launchpad
Hit the button on the top right from the Model Evaluation screen to send your tuned configuration to Launchpad. You can then download it from there and put it on the devices you need!