AIStudio Walk-Through#
Welcome to MicroAI’s AIStudio walk-through! AIStudio is a platform that allows you to demonstrate the value or tune MicroAI’s AtomML[+] products for your unique use-case. In this walk-through we’ll be going through how you can get started with AIStudio to deliver the value that you need.
Steps#
0. Create a Launchpad Account#
Create a launchpad account here. You need a launchpad account to start AIStudio.
1. Prepare to Load Data#
AIStudio is a platform that takes your data and allows you to visualize it, analyze it, and see what kind of results you get with MicroAI’s software stack.
You can download a sample dataset to follow along here.
If we open this dataset in we can see the following at the top of the header.
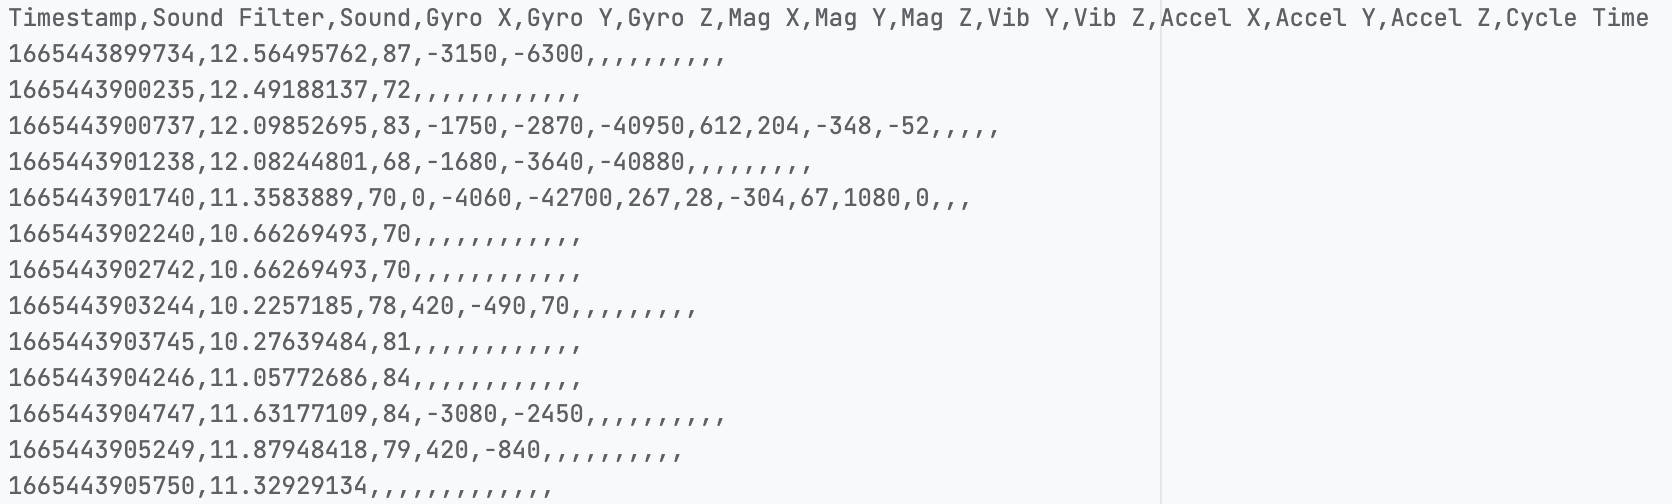
Here we see the names of different sensor names which have fed data to make this CSV make up the headers of the CSV. Each column of the CSV makes up the data collected for a particular sensor over a specified timer period. We also have ‘Timestamp’ column which indicates the times at which data is recieved from each sensor. The Timestamp is a Unix Timestamp of Millisecond Precision (i.e. the number of milliseconds that have passed since January 1st, 1970 at UTC). To find more information about the format for data in AIStudio if you want to upload your own see Uploading Historical Data to AIStudio.
2. Start AIStudio#
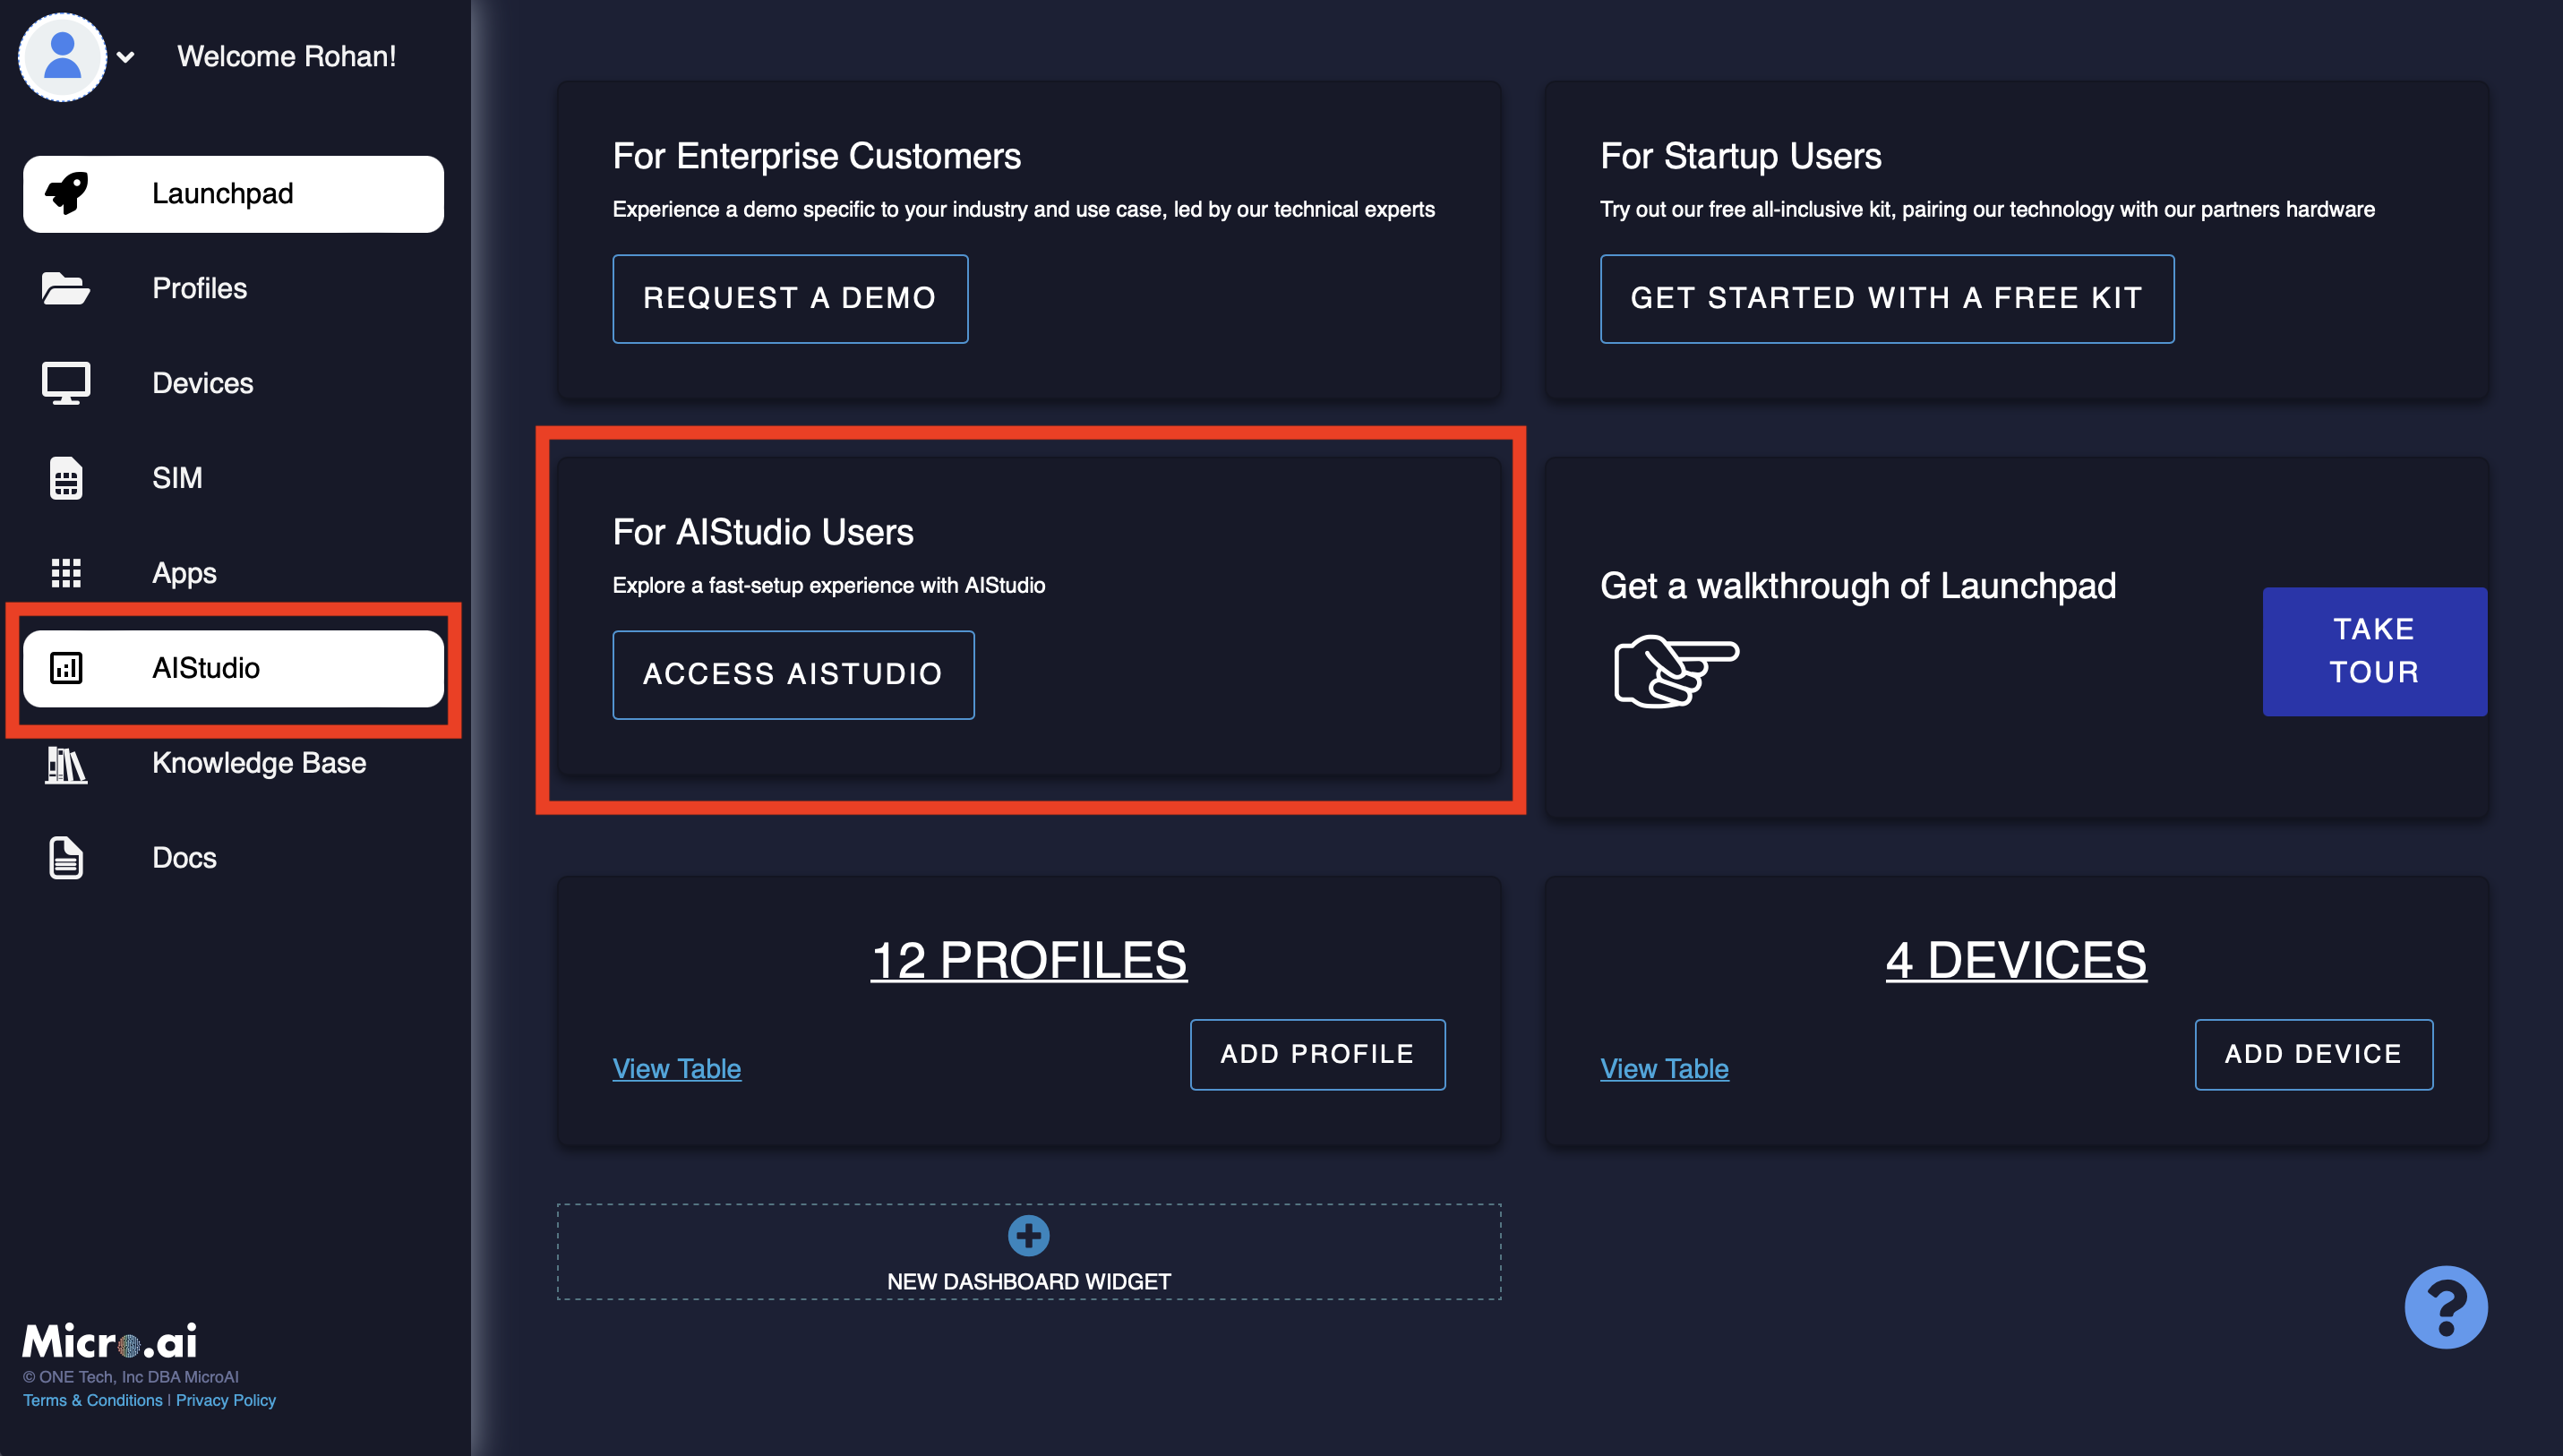
This part is simple. Use one of the following links on the main Launchpad page to start AIStudio.
If this is your first time using AIStudio you’ll be asked if you’d like to use the AIStudio Service (nothing will be charged until a credit card is added to the account).
4. Create an AIStudio Session and Upload Data#
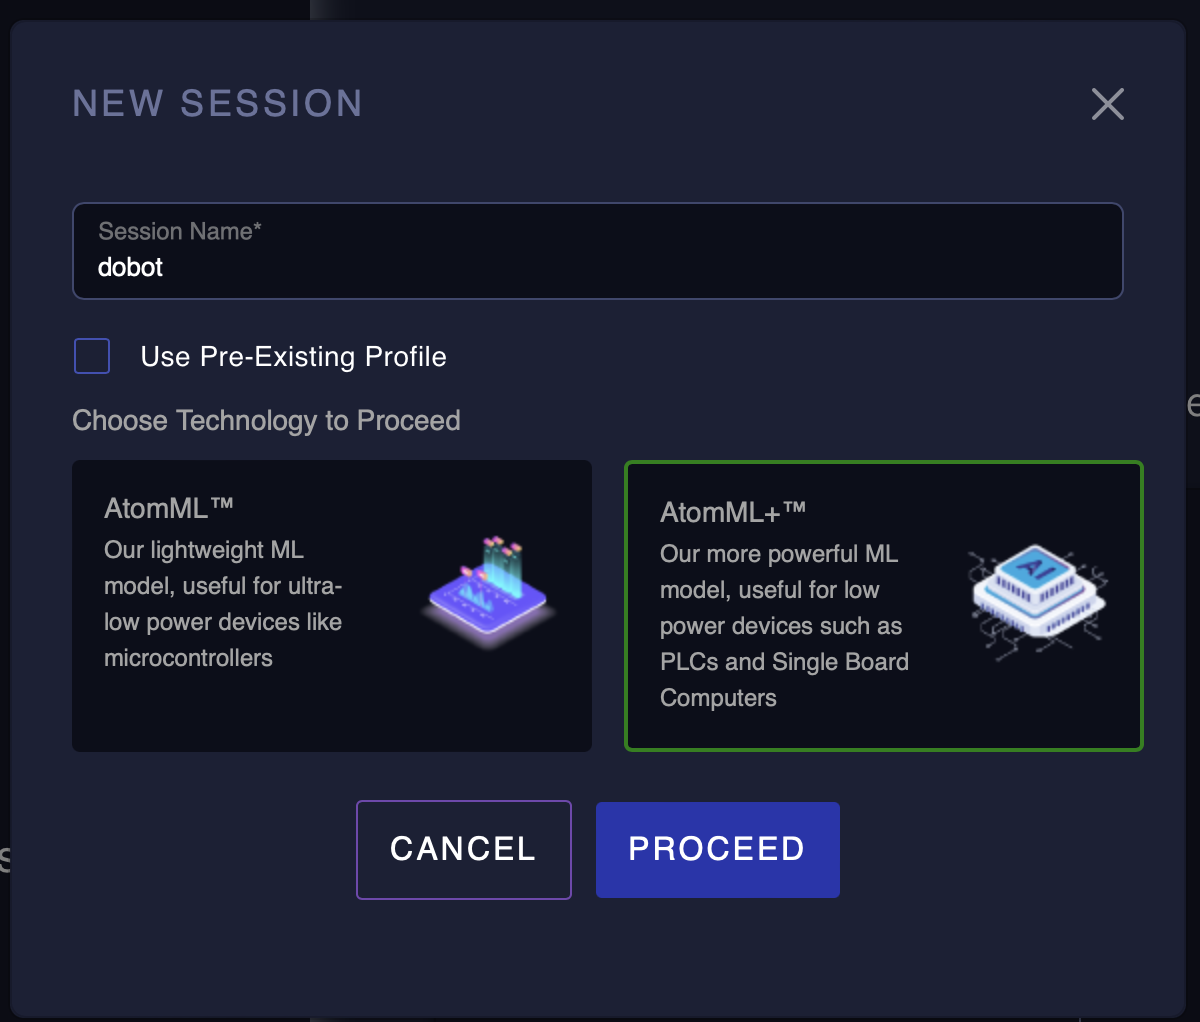
Click the big button that says “Start New Session”, give your session a name and select a technology between AtomML and AtomML+.
AtomML is our lower power, high efficiency ML tool that is meant for edge Microcontroller Units. AtomML+ is a higher power iteration of the same product that leverages the power of more powerful computing units.
For the purposes of this tutorial, we’ll be using AtomML+.
You’ll be greeted with a screen asking you to import data. If you’re using a file or the dobot dataset that we’ve provided you can choose the file from your local system, hit upload and it’ll begin the upload process. We do some processing on the data so it may take some time.
A common issue that people run into is uploading files with incorrect formatting. Check out our guide here if you need help.
5. Explore Your Data#
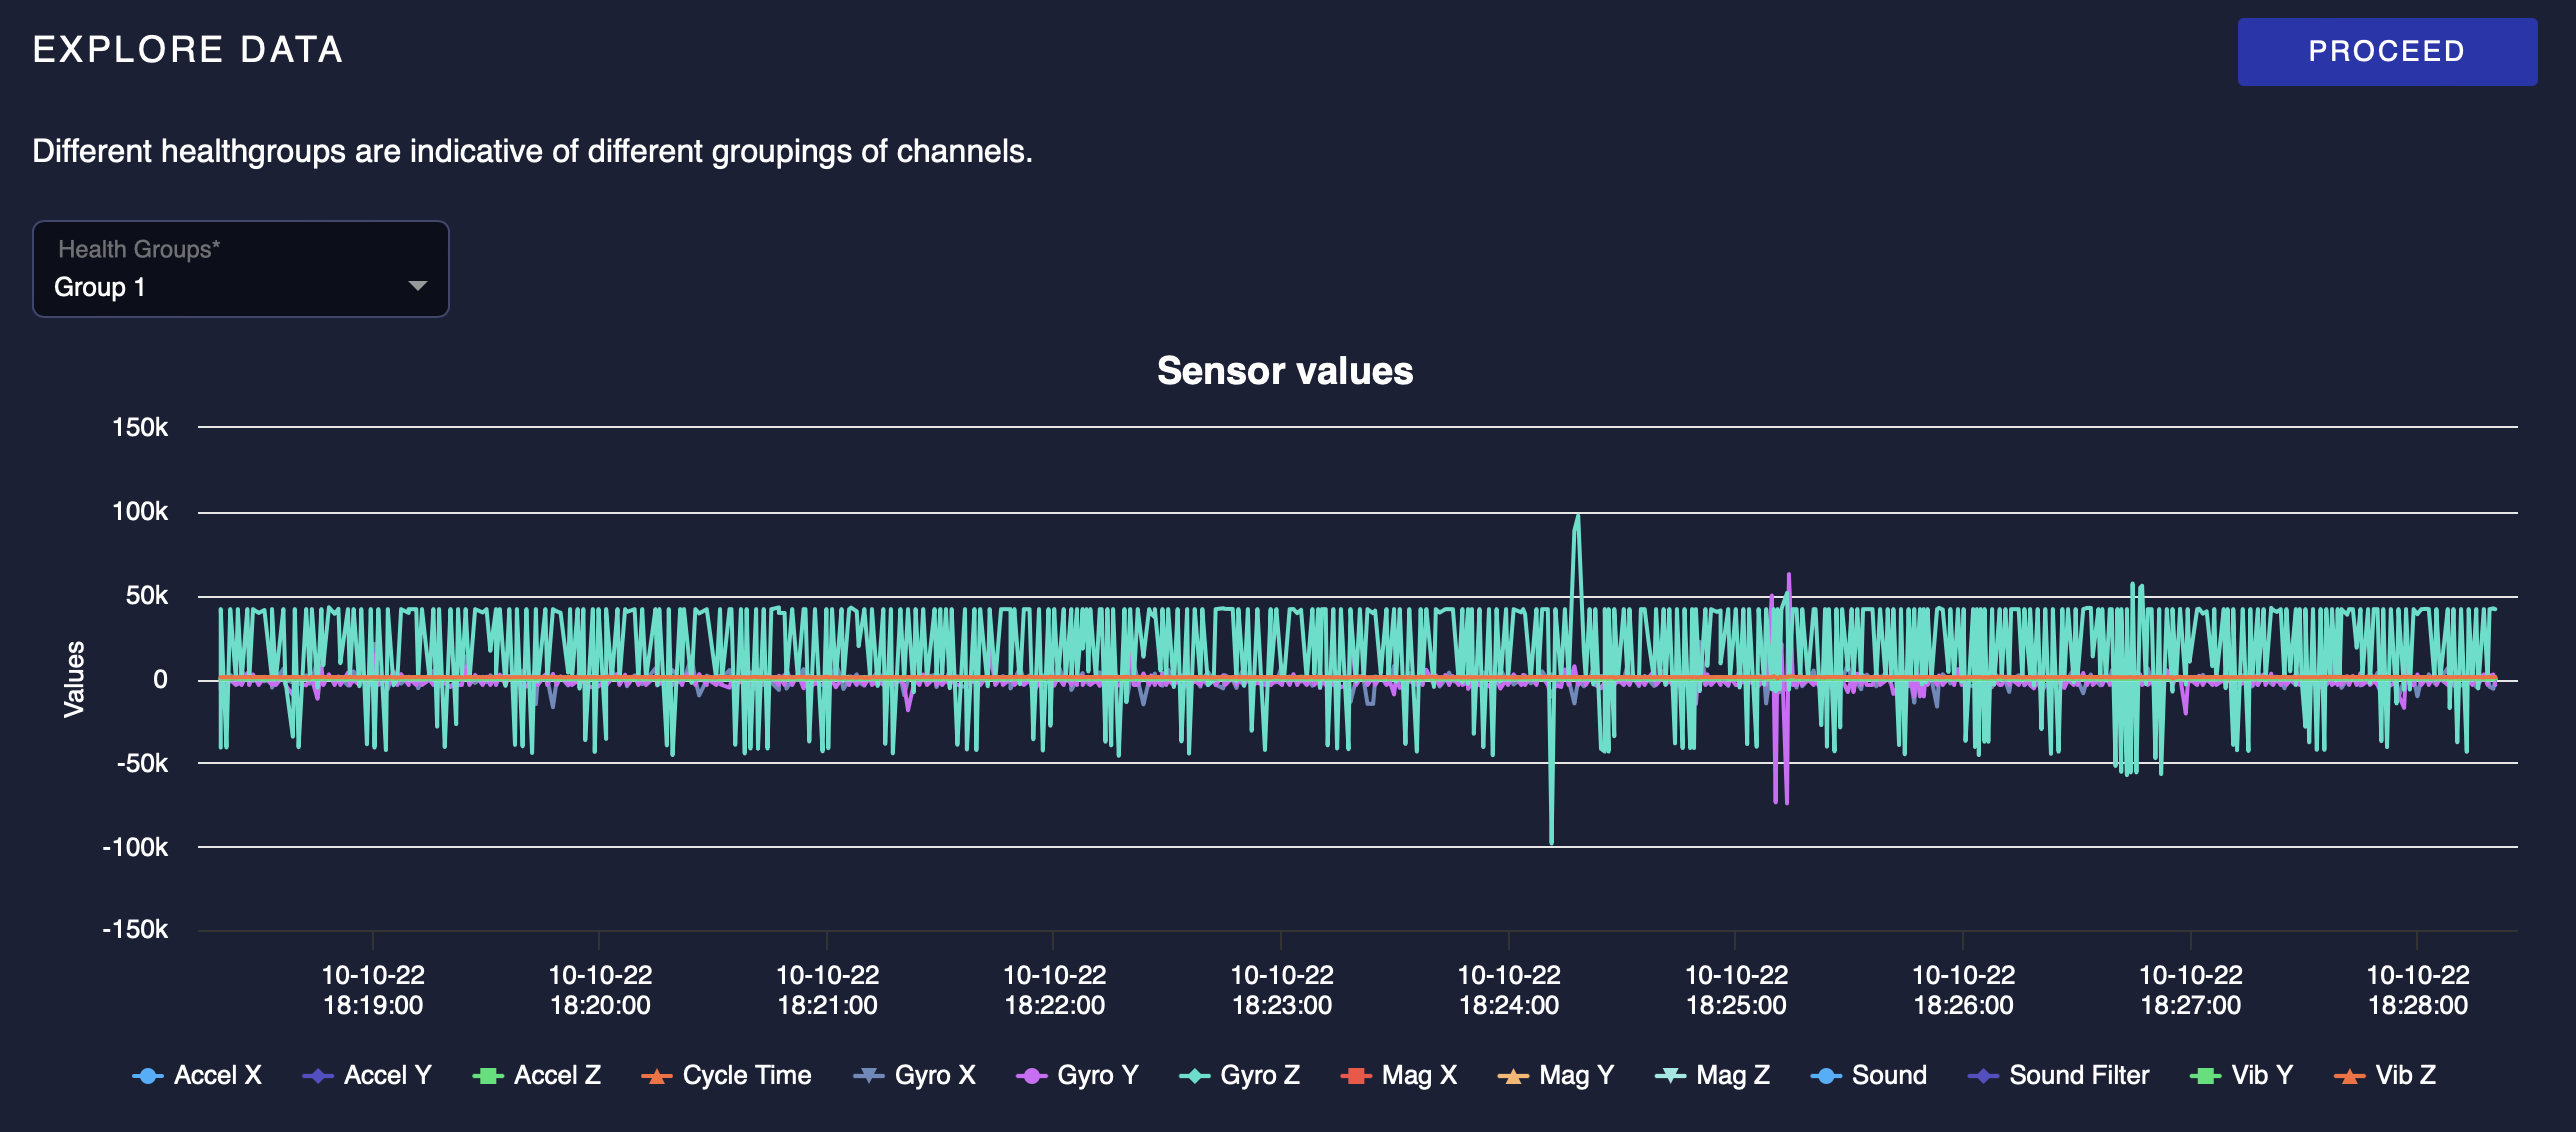
The explore data tab allows you to visualize your data and design a game plan about how you might want to augment it in the future.
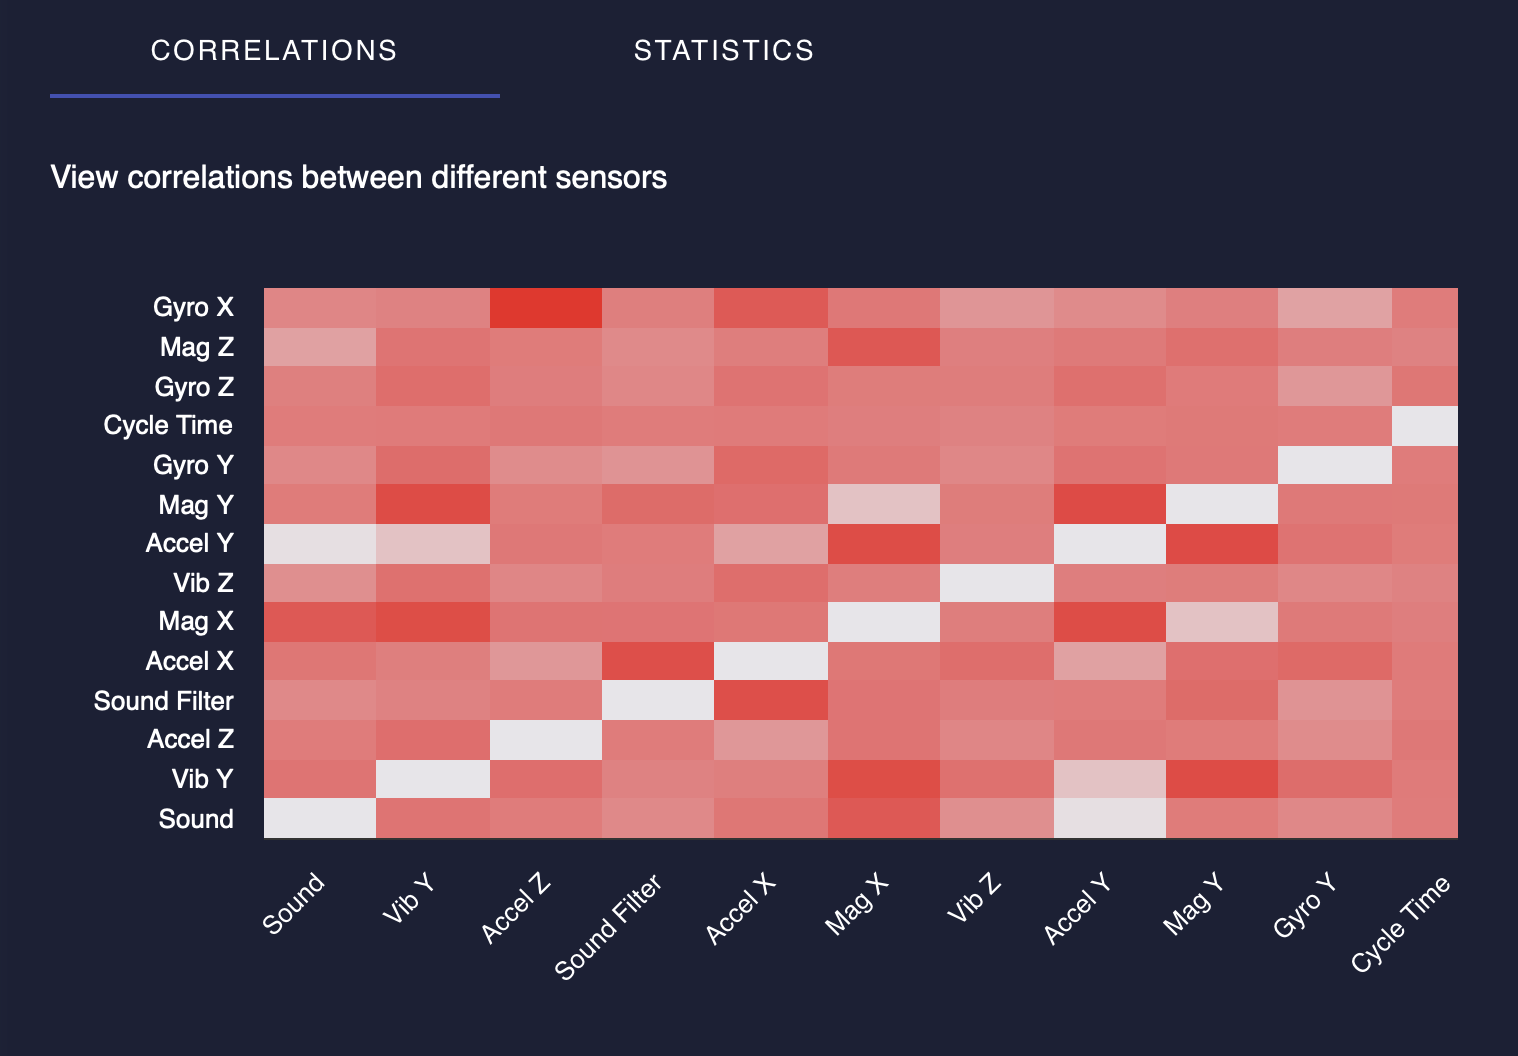
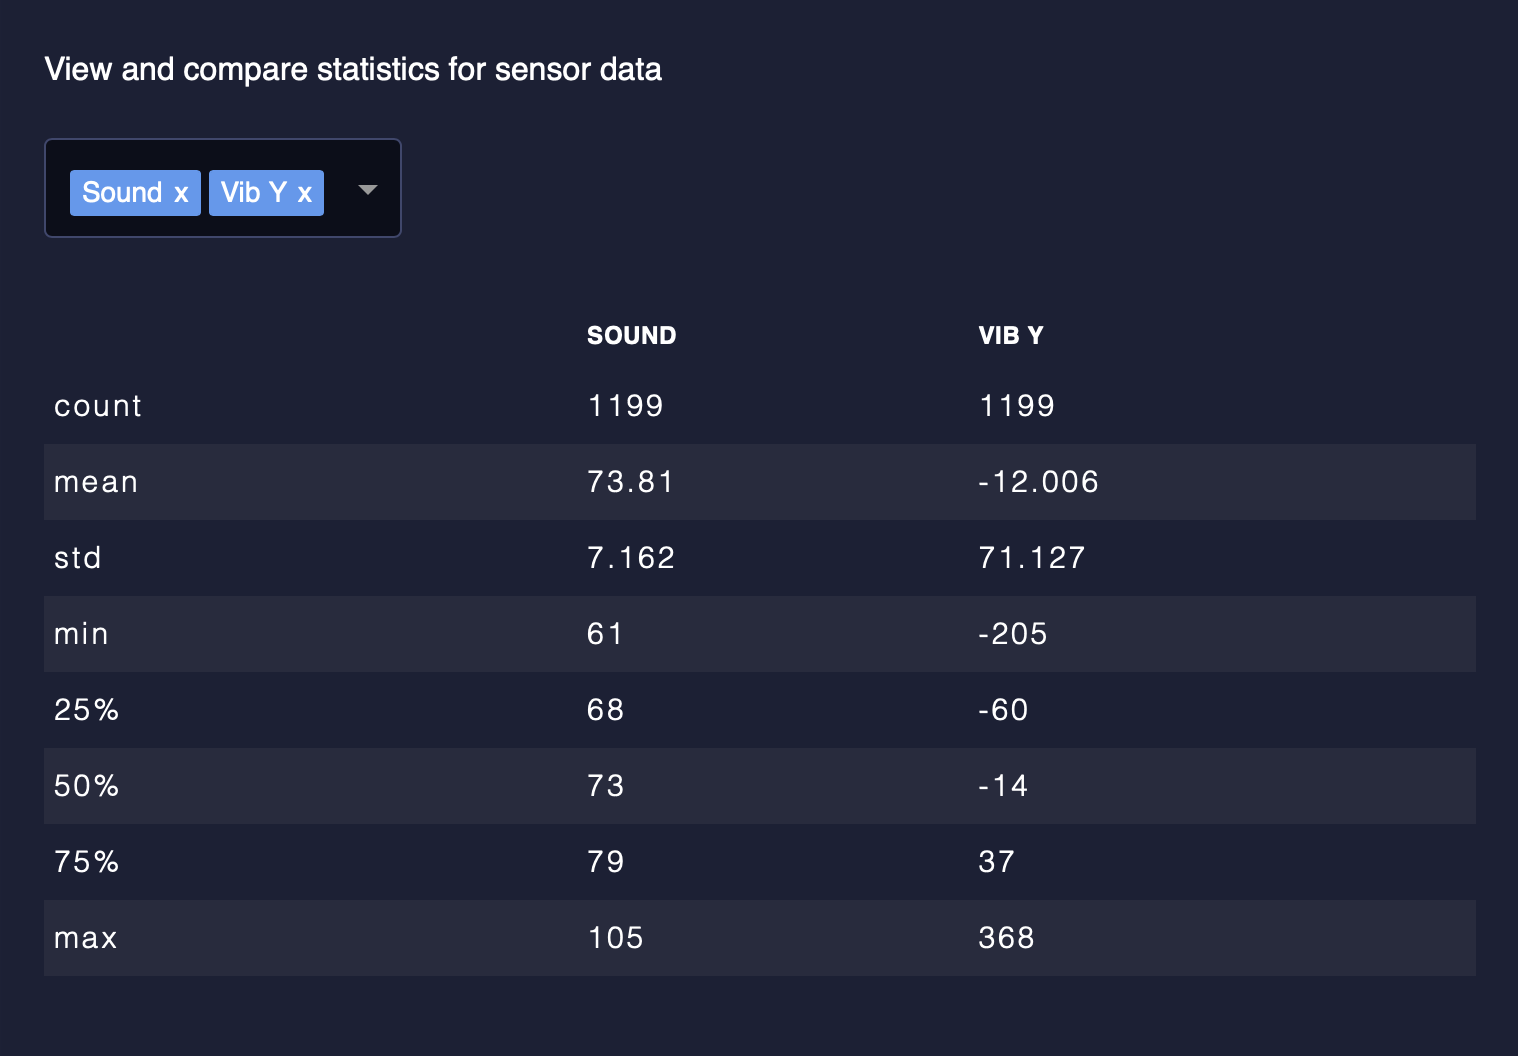
You can identify problematic channels here, view the channels that have a high correlation and the statistics of each channel
With the dobot dataset you downloaded, you can double-click the Gyro Y sensor and you’ll see that there is a very clear anomaly which occurs around 3/4th of the way through. You can flick through each channel and see how the anomaly manifests independently.
Explore Data - Allows you to visualize your data and information about it.
6. Label Your Data#
One this screen you can set the training and testing split for your data and in the testing portion of your data, label the anomalies which you can see.
You can use the radio buttons on this page to flip between labelling anomalies areas of the data and setting the training duration.
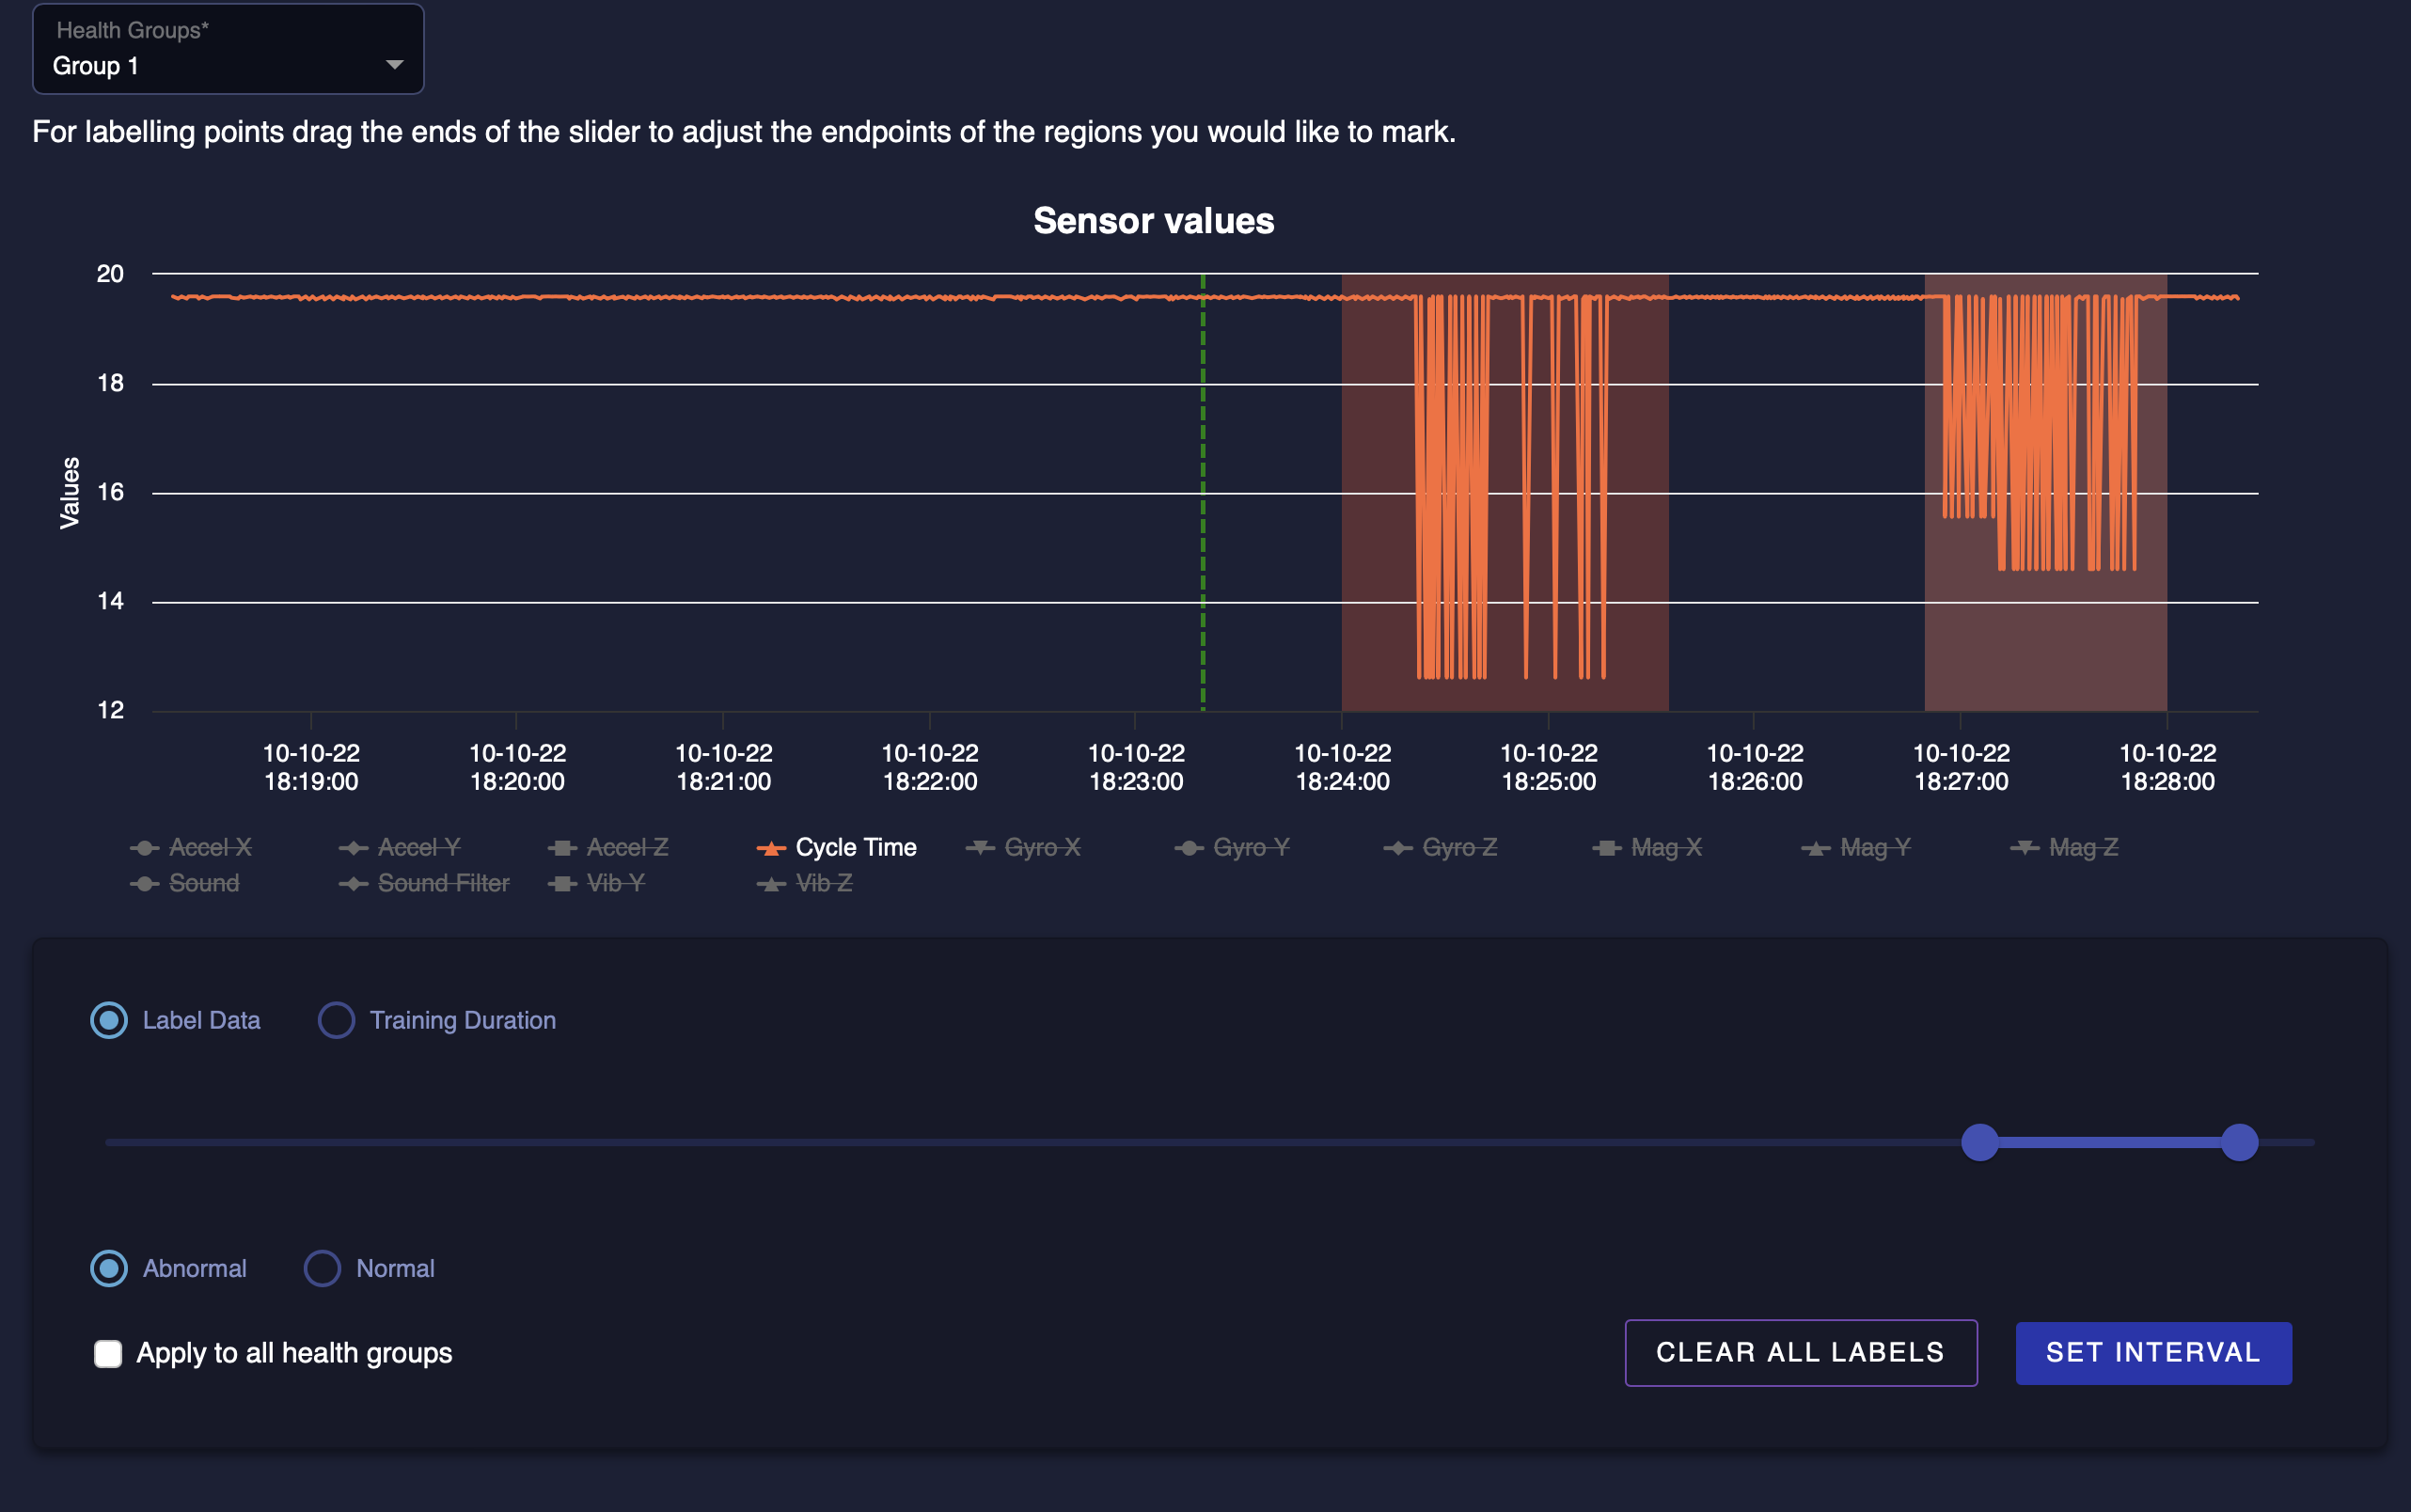
Here we’ll keep the training time at around half-way through the dataset as, after this point, there are some faults and we want to see a correct prediction on the normal part of the data as well. In this dataset, we’ve identified two anomaly areas, and have used the slider to highlight an interval and “Set Intervals” around the parts where we see them coming up.
To set the interval as we have, do the following:
Double click “Cycle Time” to highlight where the anomaly occurs.
Use the sliders at the bottom to move the selection to an interval around the anomalous behaviour.
“Set” the Interval by clicking the button
Repeat for the second anomalous interval
You can now confidently proceed to the next step.
7. Tune Your Data#
In the “Tune Channels” section you can engineer your data so that it performs better when doing anomaly detection.
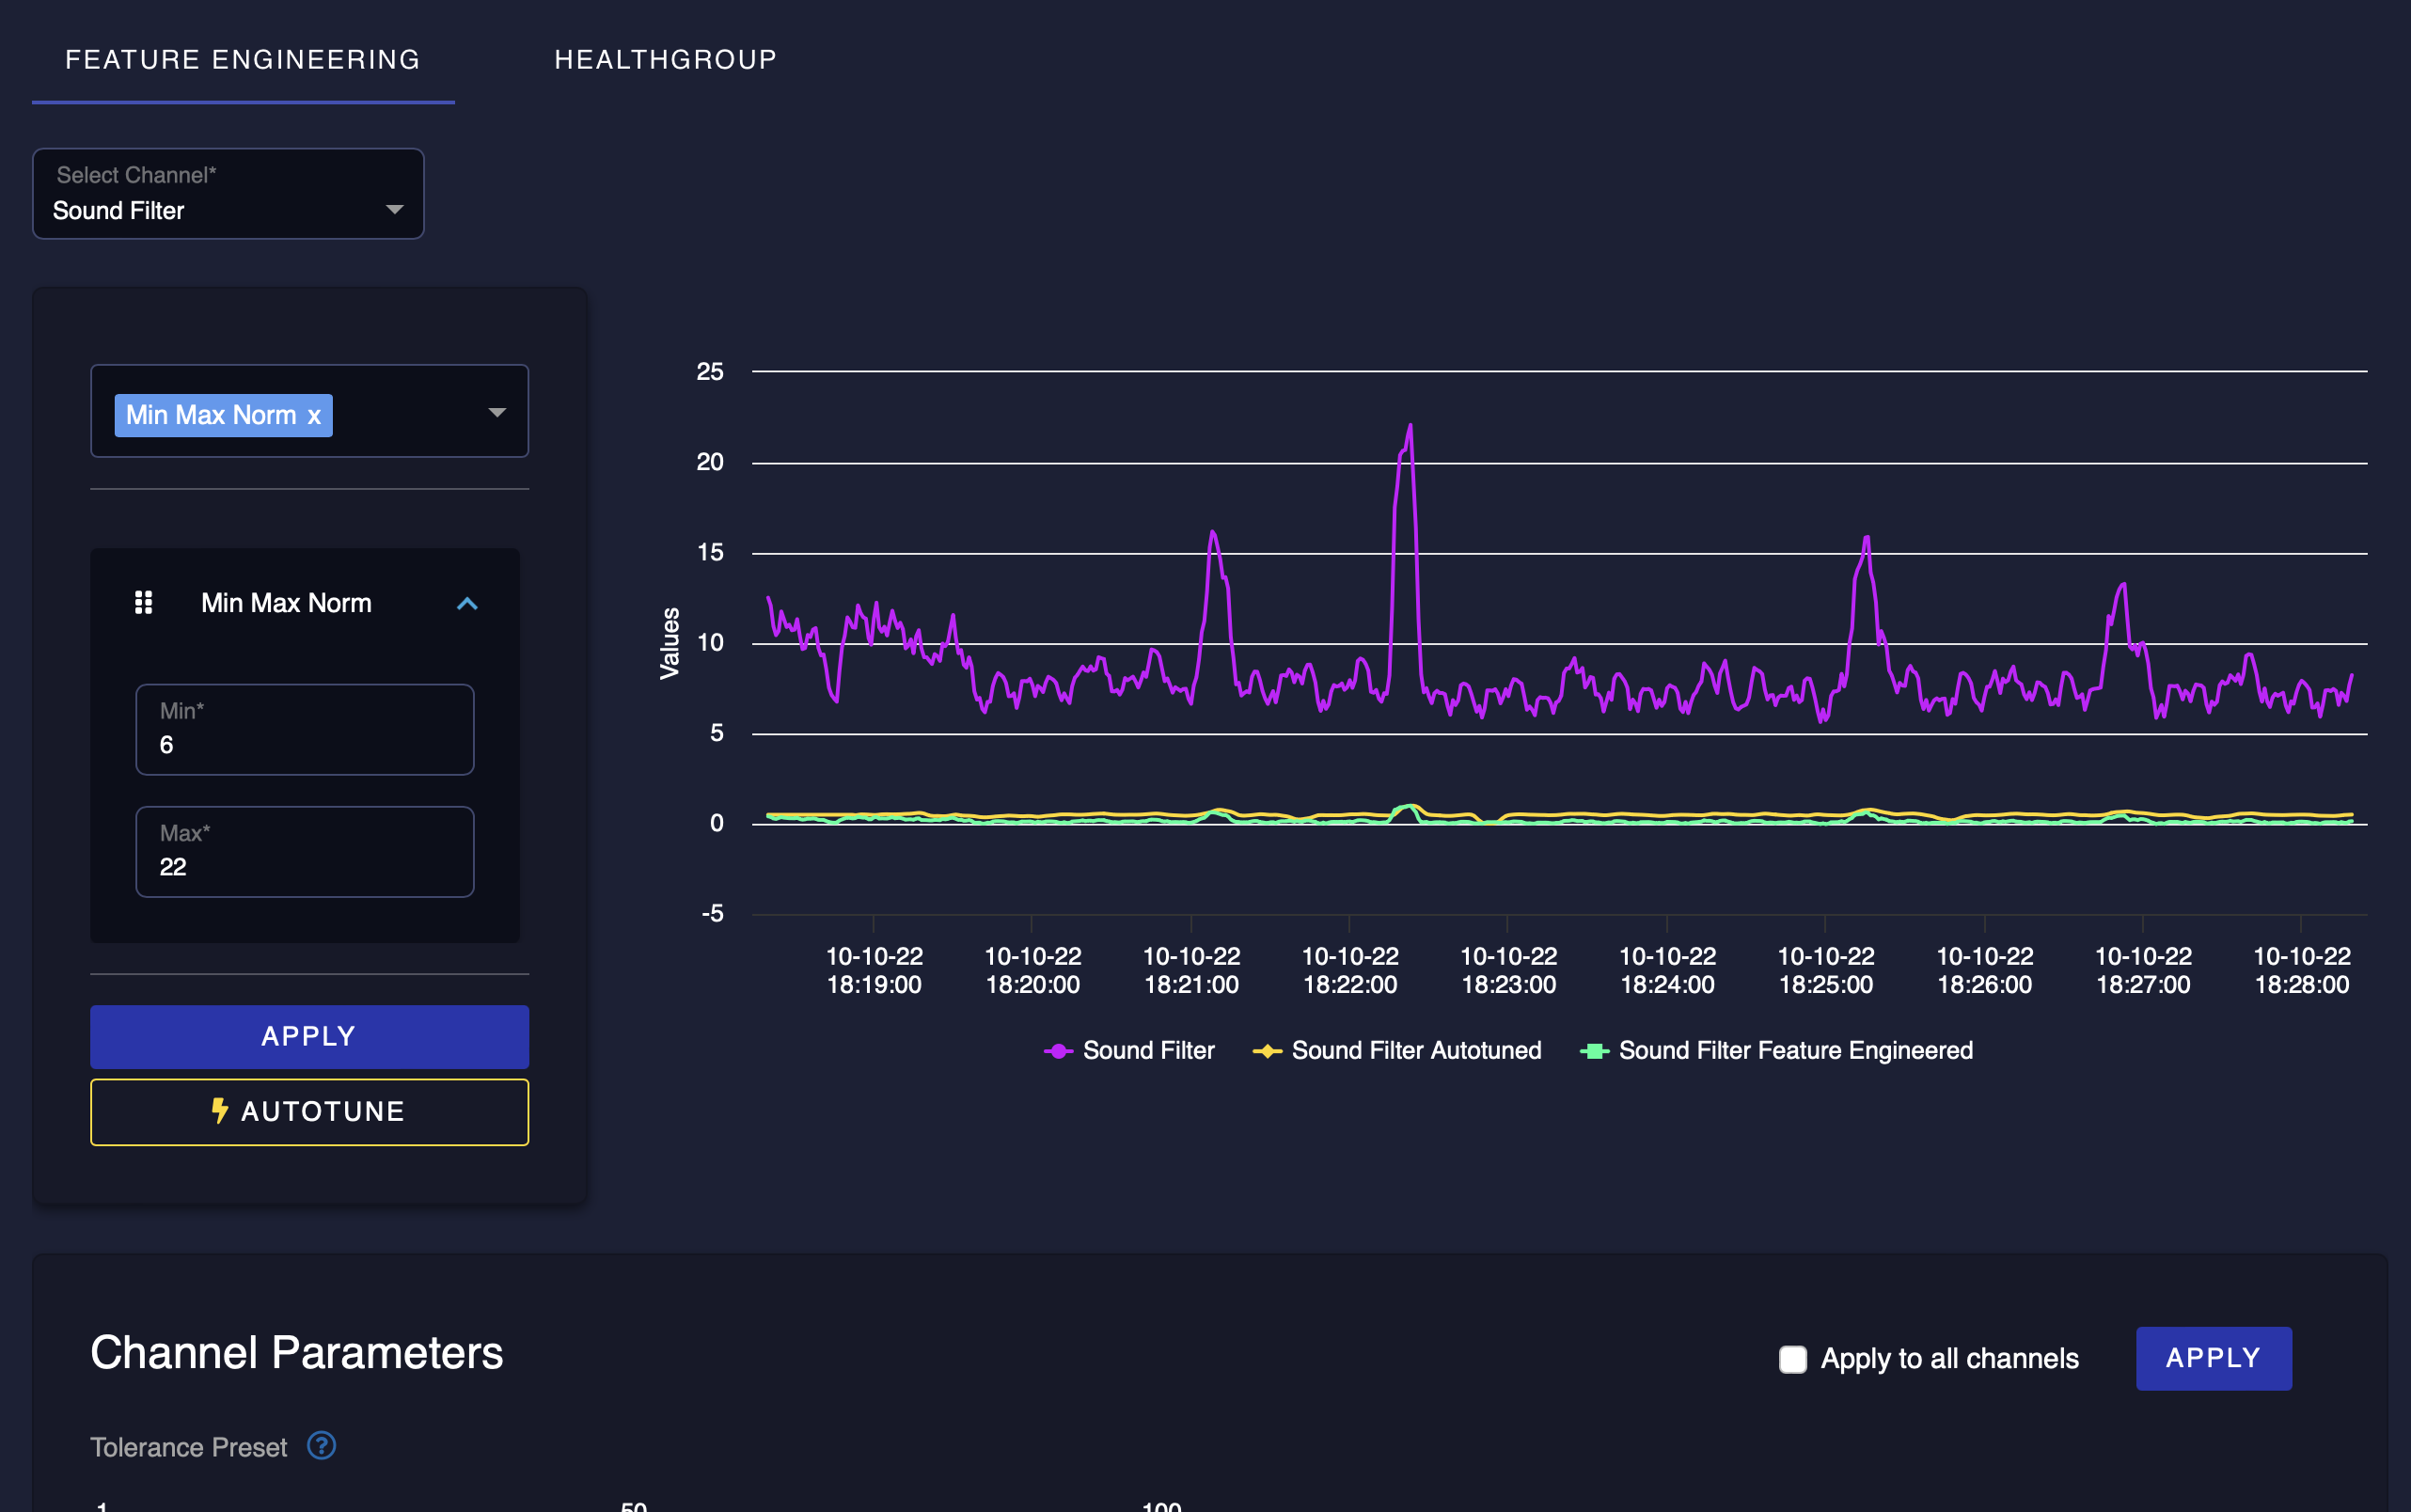
We have a feature engineering section that allows you to add functions on to your data to augment anomalies.
In the feature engineering section, you’ll see an Autotune button which allows you to select functions that we’ve detected would work best for your dataset.
Before hitting that button, try the following:
Choose a Channel
Select Min Max Norm from the drop down
Set Min to the minimum value you see in the data and Max to the maximum value you see in the data
Hit apply and see the graph change from the function you’ve applied
You can do this on a channel by channel basis. But for now we’ll move forward without adding additional feature engineering.
As you scroll down you’ll see a section that says ‘Channel Parameters’. This section basically defines how strict the AI is going to be when it witnesses an anomaly. Set the tolerance preset to 50, hit “Apply to All Channels” and then “Apply”.
8. Run AtomML[+]#
You’ve reached the easiest part. Just hit Start AtomML+ and you’ll soon be able to witness the results we’ll be able to offer you on the data. Hold off on the Autotune button for now as this can prolong execution for a long period of time, but this button can speed up your ability to tune our platform for your data.
This is the heart of AIStudio. You can run our AI, just as it would on your device and view the results that it has on your data nearly instantly.
9. Evaluate the Results#
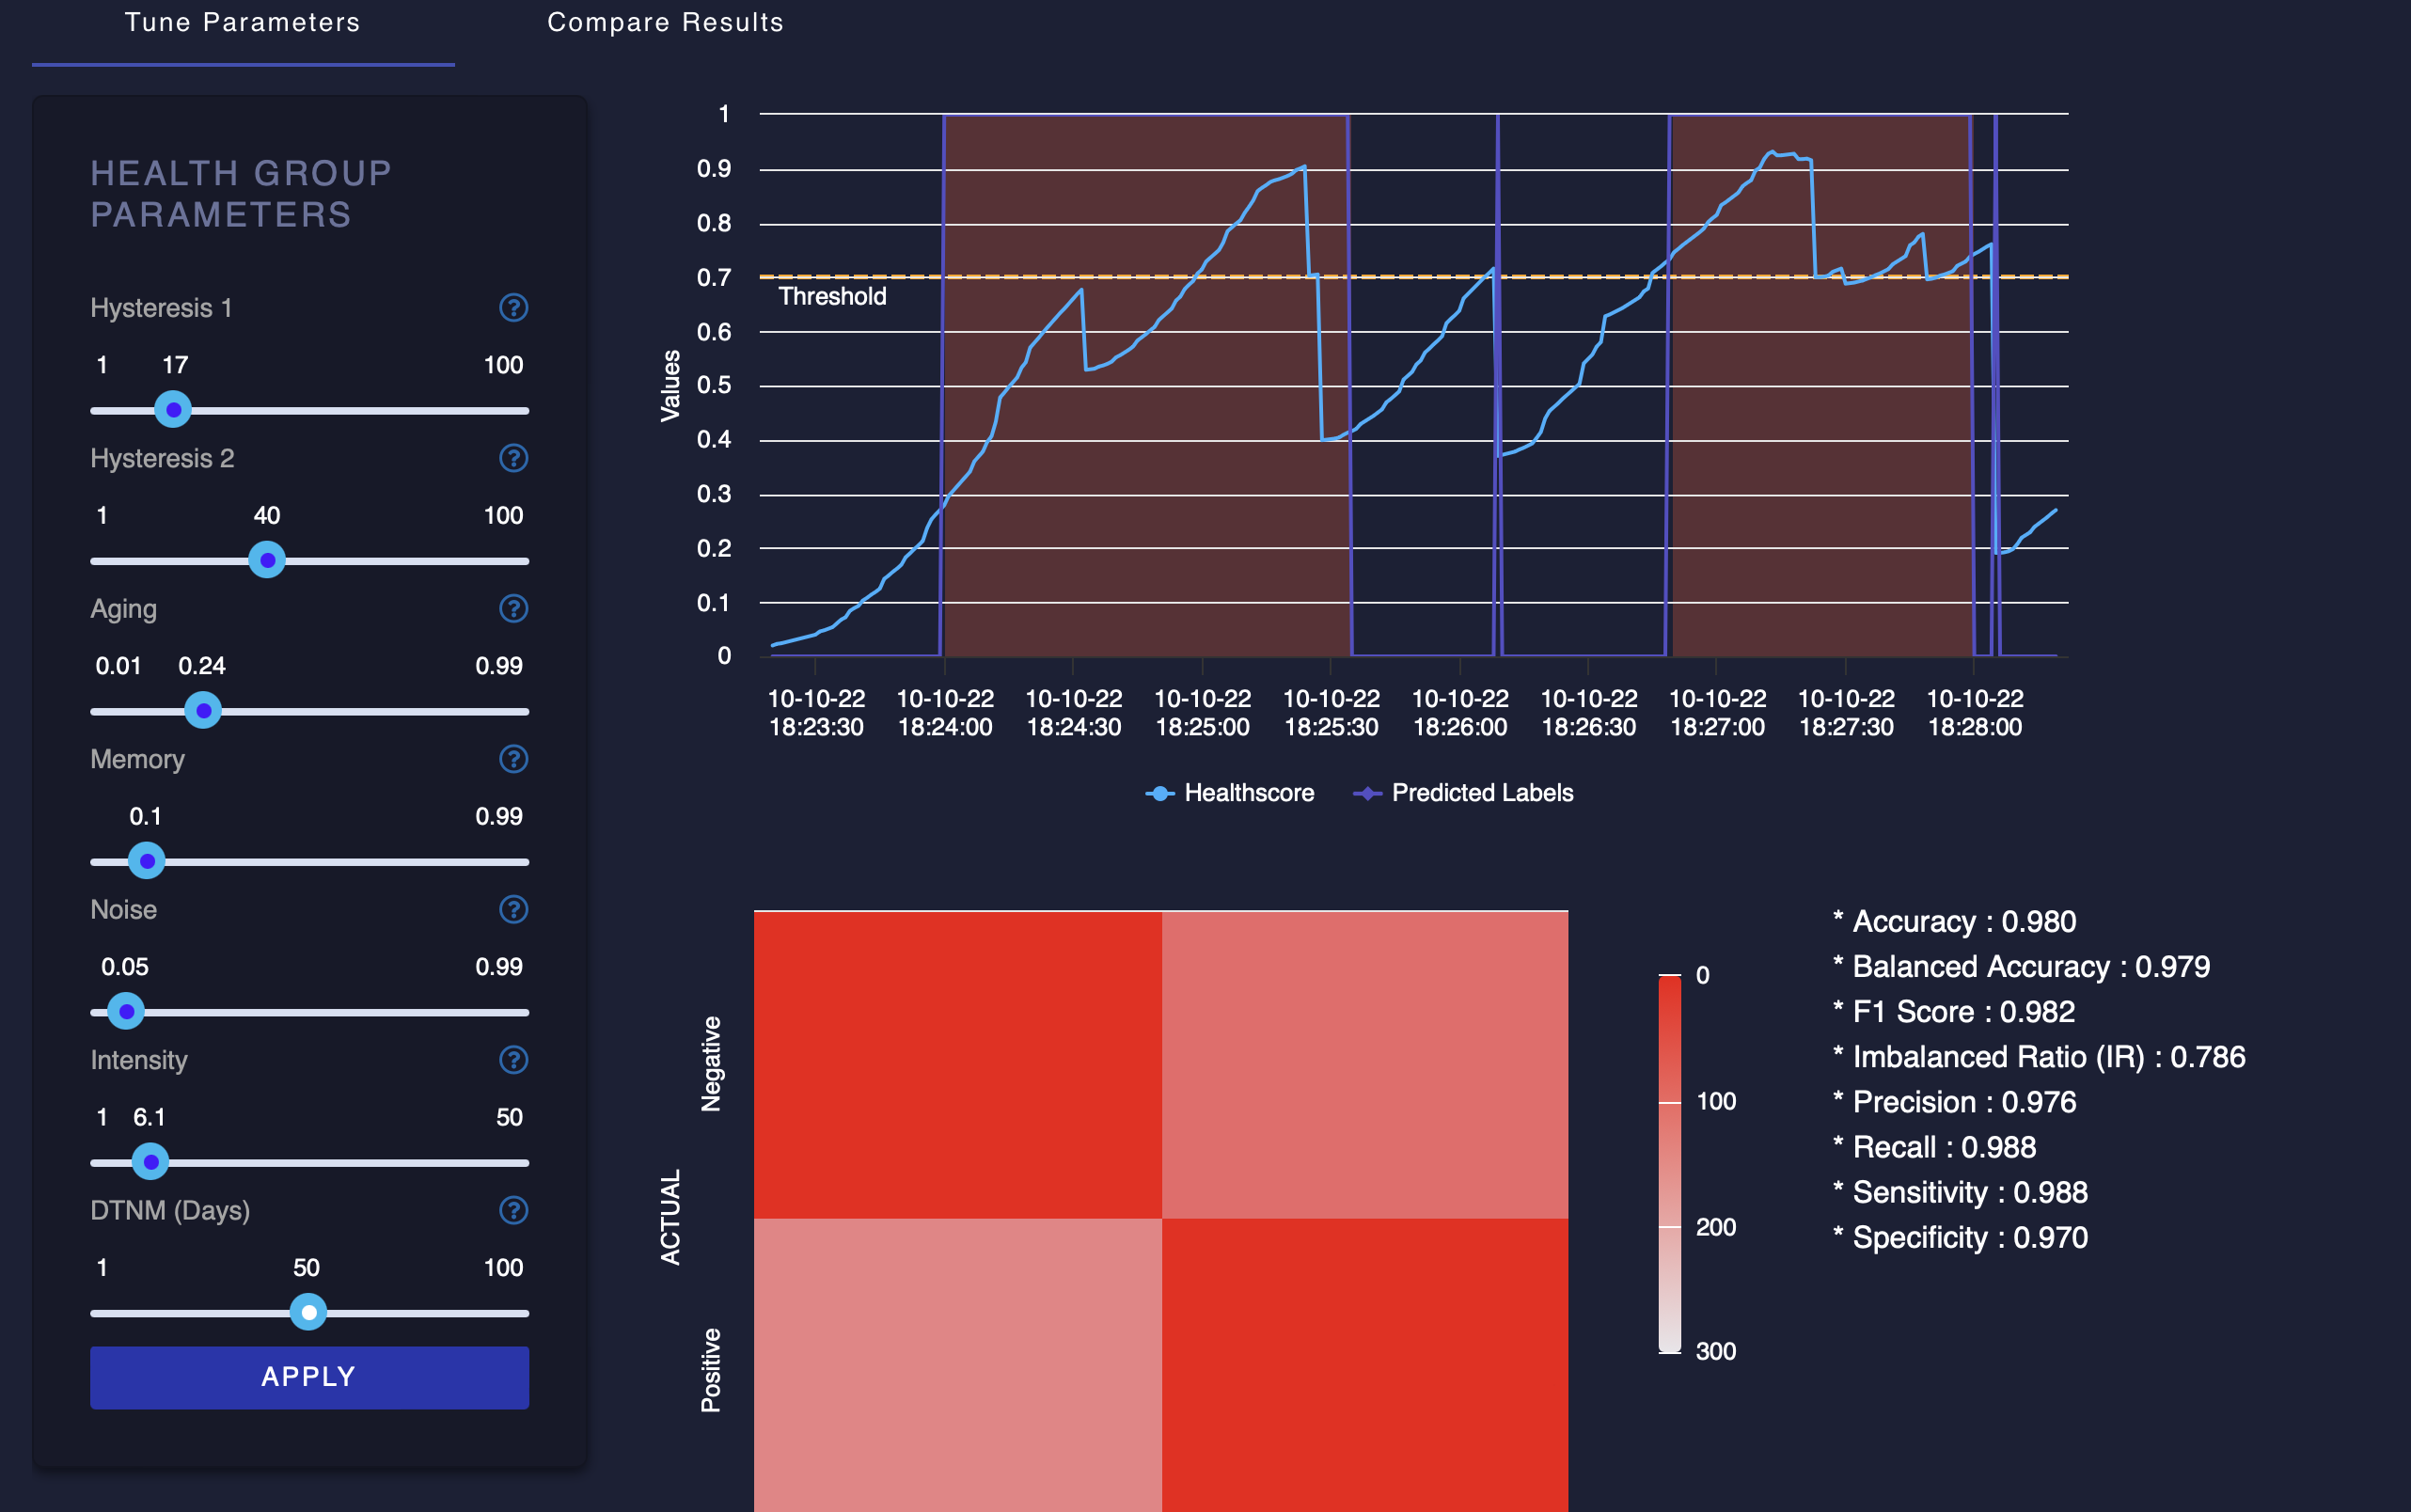
Here, we can see the results of our efforts in AIStudio.
In the graph we see two curves - the healthscore and the predicted labels.
The healthscore is a measurement of the risk that your device faces at a given moment. An accumulation of small faults will lower the healthscore. We aim to detect every major fault that occurs as well as the series of events leading up to it.
Your healthscore won’t look exactly like ours below because of pre-existing settings, but try adjusting the settings to get something similar to what we have below.
Based on the data that you’ve labeled, you also get performance metrics for the healthscore which can help evaluate how well our model is performing.
10. Unlock the rest of what MicroAI has to offer#
Imagine all this capability ON THE EDGE. You’ve already signed up for launchpad. There’s a lot more you can do with MicroAI.